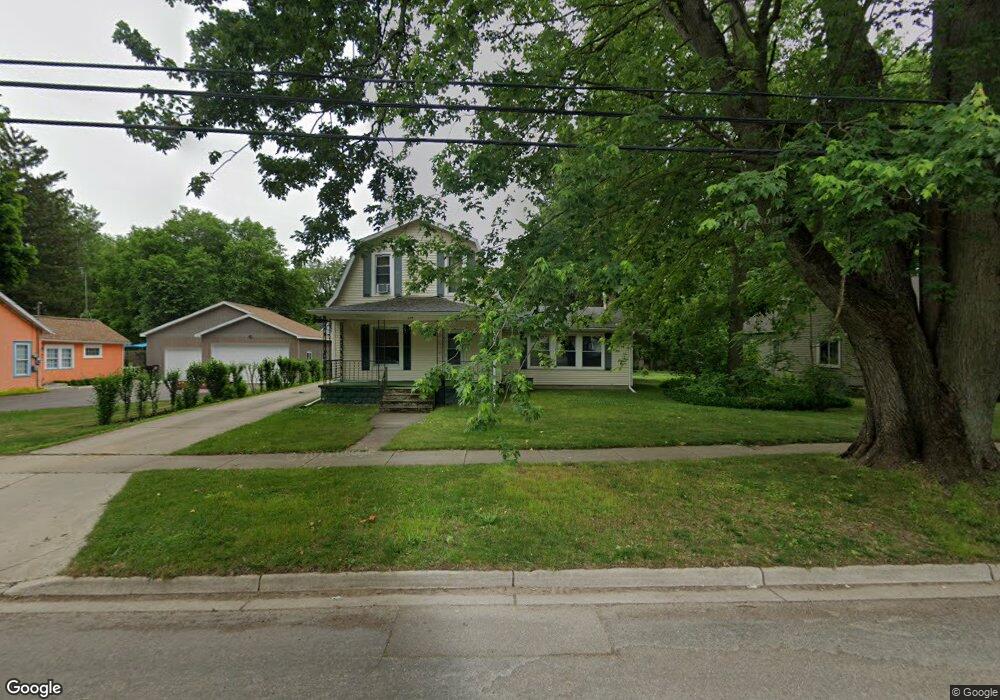
653 Ely St Allegan, MI 49010
Estimated Value: $217,000 - $234,000
3
Beds
1
Bath
1,708
Sq Ft
$130/Sq Ft
Est. Value
About This Home
This home is located at 653 Ely St, Allegan, MI 49010 and is currently estimated at $221,917, approximately $129 per square foot. 653 Ely St is a home located in Allegan County with nearby schools including West Ward Elementary School, L.E. White Middle School, and Allegan High School.
Ownership History
Date
Name
Owned For
Owner Type
Purchase Details
Closed on
Apr 20, 2010
Sold by
Hattie Revocable Living Trust
Bought by
Lockwood Joseph M
Current Estimated Value
Home Financials for this Owner
Home Financials are based on the most recent Mortgage that was taken out on this home.
Original Mortgage
$93,840
Interest Rate
5.05%
Mortgage Type
New Conventional
Purchase Details
Closed on
Nov 15, 1982
Sold by
Borgess Medical Center
Bought by
Burdick Cecil E and Burdick Hattie
Purchase Details
Closed on
Jul 17, 1964
Sold by
Hewitt Roy and Hewitt Shirley
Bought by
Burdick Cecil and Burdick Hattie
Create a Home Valuation Report for This Property
The Home Valuation Report is an in-depth analysis detailing your home's value as well as a comparison with similar homes in the area
Home Values in the Area
Average Home Value in this Area
Purchase History
| Date | Buyer | Sale Price | Title Company |
|---|---|---|---|
| Lockwood Joseph M | $92,000 | Chicago Title | |
| Burdick Cecil E | $12,500 | -- | |
| Burdick Cecil | -- | None Available | |
| Burdick Cecil | -- | -- |
Source: Public Records
Mortgage History
| Date | Status | Borrower | Loan Amount |
|---|---|---|---|
| Previous Owner | Lockwood Joseph M | $93,840 |
Source: Public Records
Tax History
| Year | Tax Paid | Tax Assessment Tax Assessment Total Assessment is a certain percentage of the fair market value that is determined by local assessors to be the total taxable value of land and additions on the property. | Land | Improvement |
|---|---|---|---|---|
| 2025 | $1,765 | $97,900 | $15,200 | $82,700 |
| 2024 | $1,606 | $85,600 | $13,200 | $72,400 |
| 2023 | $1,665 | $74,800 | $12,500 | $62,300 |
| 2022 | $1,606 | $66,400 | $10,400 | $56,000 |
| 2021 | $1,536 | $63,200 | $8,300 | $54,900 |
| 2020 | $1,514 | $57,100 | $7,600 | $49,500 |
| 2019 | $1,476 | $47,000 | $7,300 | $39,700 |
| 2018 | $1,418 | $39,400 | $7,100 | $32,300 |
| 2017 | $0 | $37,100 | $5,900 | $31,200 |
| 2016 | $0 | $31,600 | $5,000 | $26,600 |
| 2015 | -- | $31,600 | $5,000 | $26,600 |
| 2014 | -- | $33,600 | $5,000 | $28,600 |
| 2013 | $1,394 | $36,400 | $5,000 | $31,400 |
Source: Public Records
Map
Nearby Homes
Your Personal Tour Guide
Ask me questions while you tour the home.