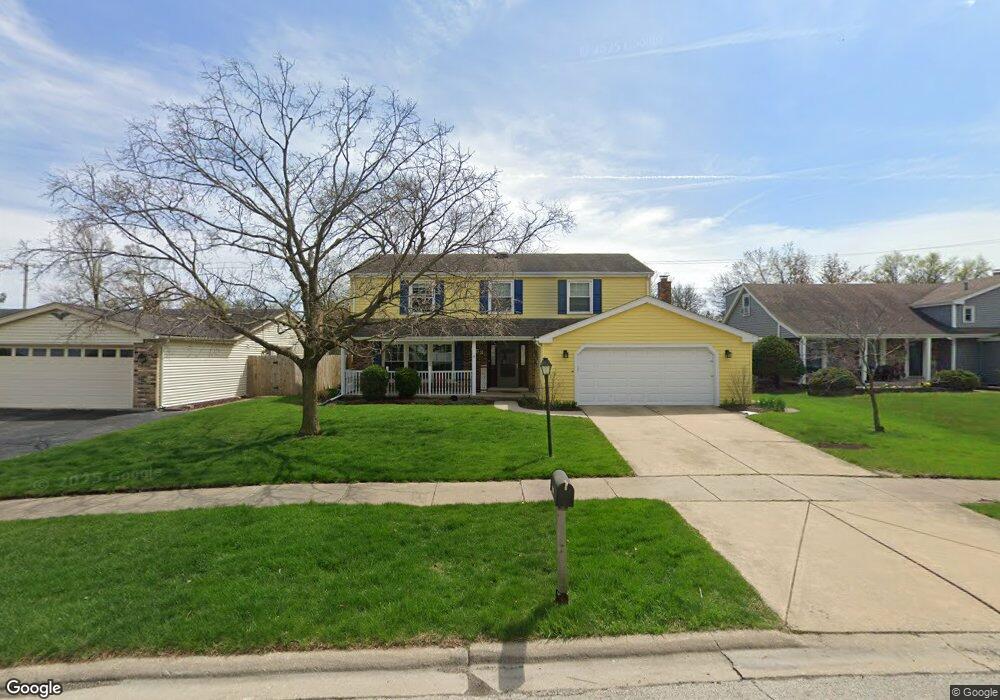
653 Independence Ave Westmont, IL 60559
North Westmont NeighborhoodEstimated Value: $553,646 - $684,000
4
Beds
3
Baths
2,329
Sq Ft
$264/Sq Ft
Est. Value
About This Home
This home is located at 653 Independence Ave, Westmont, IL 60559 and is currently estimated at $615,412, approximately $264 per square foot. 653 Independence Ave is a home located in DuPage County with nearby schools including C E Miller Elementary School, J T Manning Elementary School, and Westmont Jr High School.
Ownership History
Date
Name
Owned For
Owner Type
Purchase Details
Closed on
Oct 26, 2021
Sold by
Munsie Stephen and Munsie Julie A
Bought by
Munsie Stephen and Munsie Julie A
Current Estimated Value
Purchase Details
Closed on
Mar 24, 2006
Sold by
Conklin Steven J and Conklin Jody R
Bought by
Munsie Stephen and Munsie Julie A
Home Financials for this Owner
Home Financials are based on the most recent Mortgage that was taken out on this home.
Original Mortgage
$318,400
Outstanding Balance
$182,593
Interest Rate
6.42%
Mortgage Type
Fannie Mae Freddie Mac
Estimated Equity
$432,819
Purchase Details
Closed on
Mar 18, 1997
Sold by
Mailath Aurel G and Mailath Ronald C
Bought by
Conklin Steven J and Conklin Jody R
Home Financials for this Owner
Home Financials are based on the most recent Mortgage that was taken out on this home.
Original Mortgage
$135,000
Interest Rate
7.12%
Create a Home Valuation Report for This Property
The Home Valuation Report is an in-depth analysis detailing your home's value as well as a comparison with similar homes in the area
Home Values in the Area
Average Home Value in this Area
Purchase History
| Date | Buyer | Sale Price | Title Company |
|---|---|---|---|
| Munsie Stephen | -- | Attorney | |
| Munsie Stephen | $398,000 | Atg | |
| Conklin Steven J | $180,000 | Attorneys Title Guaranty Fun |
Source: Public Records
Mortgage History
| Date | Status | Borrower | Loan Amount |
|---|---|---|---|
| Open | Munsie Stephen | $318,400 | |
| Previous Owner | Conklin Steven J | $135,000 |
Source: Public Records
Tax History Compared to Growth
Tax History
| Year | Tax Paid | Tax Assessment Tax Assessment Total Assessment is a certain percentage of the fair market value that is determined by local assessors to be the total taxable value of land and additions on the property. | Land | Improvement |
|---|---|---|---|---|
| 2024 | $9,214 | $150,628 | $50,333 | $100,295 |
| 2023 | $8,704 | $138,470 | $46,270 | $92,200 |
| 2022 | $8,479 | $133,640 | $44,650 | $88,990 |
| 2021 | $8,149 | $132,120 | $44,140 | $87,980 |
| 2020 | $7,978 | $129,510 | $43,270 | $86,240 |
| 2019 | $7,705 | $124,270 | $41,520 | $82,750 |
| 2018 | $7,916 | $124,420 | $41,260 | $83,160 |
| 2017 | $7,703 | $119,720 | $39,700 | $80,020 |
| 2016 | $7,578 | $114,260 | $37,890 | $76,370 |
| 2015 | $7,451 | $107,500 | $35,650 | $71,850 |
| 2014 | $7,446 | $104,520 | $34,660 | $69,860 |
| 2013 | $7,017 | $104,030 | $34,500 | $69,530 |
Source: Public Records
Map
Nearby Homes
- 245 Middaugh Rd
- 505 Citadel Cir Unit 2
- 719 Citadel Dr Unit 1
- 516 Citadel Cir Unit 2
- 246 N Jackson Rd
- 241 Coe Rd
- 548 Hamilton Ave
- 562 Revere Ave
- 141 Breakenridge Farm
- 415 N Adams St
- 410 Chicago Ave
- 214 Woodstock Ave
- 527 Kensington Ct
- 539 Kensington Ct
- 14 Templeton Dr
- 116 Oxford Ave
- 21 S Bruner St
- 102 S Quincy St
- 117 N Monroe St
- 14 S Thurlow St
- 653 Independence Ave
- 657 Independence Ave
- 649 Independence Ave
- 661 Independence Ave
- 648 Independence Ave
- 610 Newport Ave
- 641 Independence Ave
- 665 Independence Ave
- 295 Columbine Dr
- 291 Columbine Dr
- 601 Newport Ave
- 293 Columbine Dr
- 611 Champlaine Ave
- 297 Columbine Dr
- 299 Columbine Dr
- 614 Newport Ave
- 637 Independence Ave
- 605 Newport Ave
- 640 Independence Ave
- 289 Columbine Dr