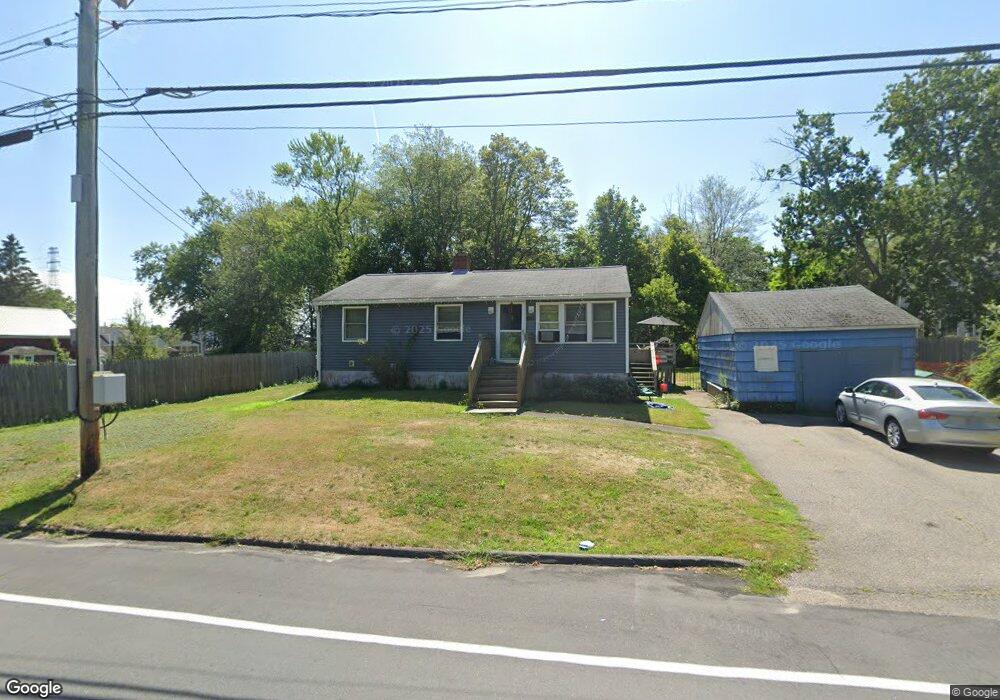
653 Main St Eliot, ME 03903
South Eliot NeighborhoodEstimated Value: $370,000 - $452,000
3
Beds
1
Bath
864
Sq Ft
$475/Sq Ft
Est. Value
About This Home
This home is located at 653 Main St, Eliot, ME 03903 and is currently estimated at $410,202, approximately $474 per square foot. 653 Main St is a home located in York County with nearby schools including Marshwood High School and Seacoast Waldorf School.
Ownership History
Date
Name
Owned For
Owner Type
Purchase Details
Closed on
Sep 24, 2007
Sold by
Pettibone Michael S and Pettibone Carolyn M
Bought by
Pettibone Susan J
Current Estimated Value
Home Financials for this Owner
Home Financials are based on the most recent Mortgage that was taken out on this home.
Original Mortgage
$140,000
Interest Rate
6.63%
Mortgage Type
Unknown
Create a Home Valuation Report for This Property
The Home Valuation Report is an in-depth analysis detailing your home's value as well as a comparison with similar homes in the area
Home Values in the Area
Average Home Value in this Area
Purchase History
| Date | Buyer | Sale Price | Title Company |
|---|---|---|---|
| Pettibone Susan J | -- | -- |
Source: Public Records
Mortgage History
| Date | Status | Borrower | Loan Amount |
|---|---|---|---|
| Open | Pettibone Susan J | $160,000 | |
| Closed | Pettibone Susan J | $140,000 |
Source: Public Records
Tax History
| Year | Tax Paid | Tax Assessment Tax Assessment Total Assessment is a certain percentage of the fair market value that is determined by local assessors to be the total taxable value of land and additions on the property. | Land | Improvement |
|---|---|---|---|---|
| 2024 | $3,141 | $265,100 | $117,700 | $147,400 |
| 2023 | $2,976 | $242,900 | $112,300 | $130,600 |
| 2022 | $2,807 | $232,000 | $112,300 | $119,700 |
| 2021 | $2,890 | $214,100 | $103,300 | $110,800 |
| 2020 | $1,412 | $193,500 | $98,800 | $94,700 |
| 2019 | $2,844 | $193,500 | $98,800 | $94,700 |
| 2018 | $1,498 | $193,500 | $98,800 | $94,700 |
| 2017 | $1,448 | $193,500 | $98,800 | $94,700 |
| 2016 | $2,719 | $193,500 | $98,800 | $94,700 |
| 2015 | $2,709 | $193,500 | $98,800 | $94,700 |
| 2014 | $2,670 | $193,500 | $98,800 | $94,700 |
| 2013 | $2,548 | $193,500 | $98,800 | $94,700 |
Source: Public Records
Map
Nearby Homes
- 18 Shipping Ln
- 1128 State Rd
- 8 Caslyn Dr
- 22 Summer Ln
- 62 Village Dr Unit 62
- 0 Franks Fort Island Unit 1650383
- 5 Spinney Way Unit 9
- 96 Spinnaker Way
- 45 Shearwater Dr
- 37 Shearwater Dr Unit 1906
- 14 Birch St
- 1360 Woodbury Ave
- 25 Oak Terrace
- 27 Oak Terrace
- 19 Aspen Cir
- 80 Woodlawn Cir
- 525 Maplewood Ave Unit 9
- 197 State Rd
- 35 Badgers Island W Unit 203
- 35 Badgers Island W Unit 301
- LOT B Main St
- LOT C Main St
- 663 Main St
- 28 Rosemary Ln
- 0 Bolt Hill Rd Unit 4324763
- 0 Bolt Hill Rd
- 0 Bolt Hill Rd Unit 993448
- 0 Bolt Hill Rd Unit 993554
- 0 Bolt Hill Rd Unit 1038100
- 0 Bolt Hill Rd Unit 1115877
- 0 Bolt Hill Rd Unit 1115876
- 0 Bolt Hill Rd Unit 1115869
- 0 Bolt Hill Rd Unit 1511271
- 662 Main St
- 297 Pleasant St
- 105 Bolt Hill Rd
- 98 Main St
- 3 Bolt Hill Rd
- 27 Rosemary Ln
- 26 Bolt Hill Rd
Your Personal Tour Guide
Ask me questions while you tour the home.