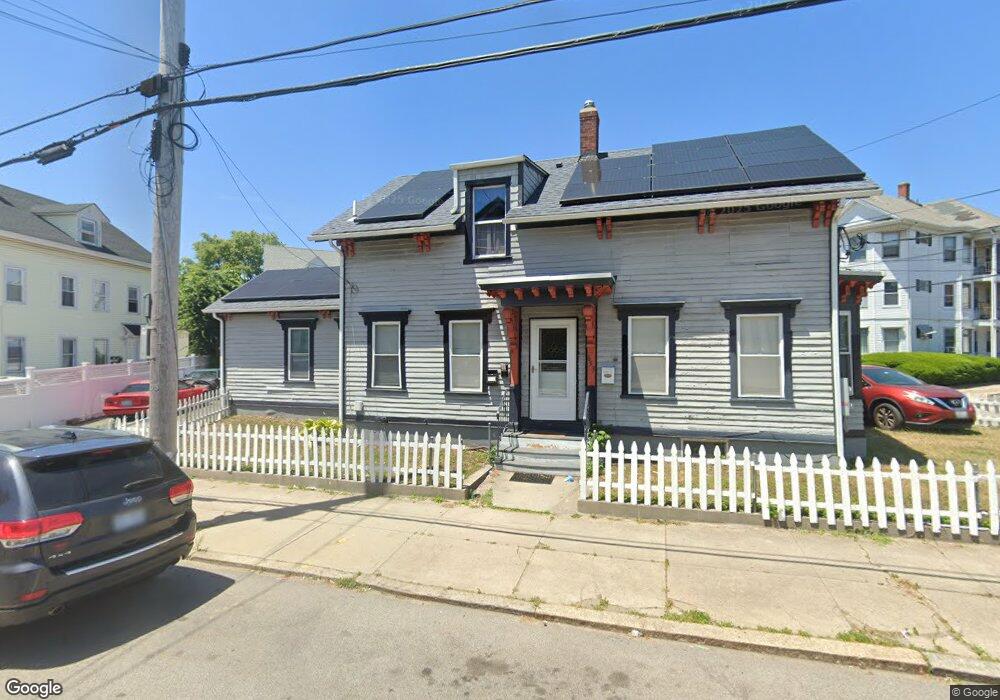
653 Main St Pawtucket, RI 02860
Downtown Pawtucket NeighborhoodEstimated Value: $410,087
Studio
--
Bath
2,624
Sq Ft
$156/Sq Ft
Est. Value
About This Home
This home is located at 653 Main St, Pawtucket, RI 02860 and is currently estimated at $410,087, approximately $156 per square foot. 653 Main St is a home located in Providence County with nearby schools including International Charter School, Blackstone Academy Charter School, and Saint Raphael Academy.
Ownership History
Date
Name
Owned For
Owner Type
Purchase Details
Closed on
Jul 3, 2012
Sold by
All Purpose Props Llc
Bought by
All Props Mgmt Llc
Current Estimated Value
Purchase Details
Closed on
Dec 14, 2005
Sold by
Jaworski Ft
Bought by
Wood Liza and Wood Brian
Home Financials for this Owner
Home Financials are based on the most recent Mortgage that was taken out on this home.
Original Mortgage
$228,000
Interest Rate
6.34%
Mortgage Type
Commercial
Create a Home Valuation Report for This Property
The Home Valuation Report is an in-depth analysis detailing your home's value as well as a comparison with similar homes in the area
Home Values in the Area
Average Home Value in this Area
Purchase History
| Date | Buyer | Sale Price | Title Company |
|---|---|---|---|
| All Props Mgmt Llc | -- | -- | |
| Wood Liza | $240,000 | -- |
Source: Public Records
Mortgage History
| Date | Status | Borrower | Loan Amount |
|---|---|---|---|
| Previous Owner | Wood Liza | $247,500 | |
| Previous Owner | Wood Liza | $228,000 |
Source: Public Records
Tax History
| Year | Tax Paid | Tax Assessment Tax Assessment Total Assessment is a certain percentage of the fair market value that is determined by local assessors to be the total taxable value of land and additions on the property. | Land | Improvement |
|---|---|---|---|---|
| 2025 | $4,229 | $321,600 | $92,300 | $229,300 |
| 2024 | -- | $321,600 | $92,300 | $229,300 |
| 2023 | $0 | $243,400 | $76,700 | $166,700 |
| 2022 | $0 | $243,400 | $76,700 | $166,700 |
| 2021 | $0 | $243,400 | $76,700 | $166,700 |
| 2020 | $0 | $195,400 | $76,700 | $118,700 |
| 2019 | $5,011 | $195,400 | $76,700 | $118,700 |
| 2018 | $0 | $195,400 | $76,700 | $118,700 |
| 2017 | $0 | $170,000 | $76,700 | $93,300 |
| 2016 | -- | $170,000 | $76,700 | $93,300 |
| 2015 | -- | $170,000 | $76,700 | $93,300 |
| 2014 | -- | $180,000 | $83,400 | $96,600 |
Source: Public Records
Map
Nearby Homes
- 16 Capital St
- 659 Main St
- 32 Capital St
- 22 Capital St
- 20 Capital St
- 11 Capital St
- 650 Main St
- 652 Main St
- 648 Main St
- 648 Main St Unit 12 white an st.
- 643 Main St Unit B
- 643 Main St
- 26 Capital St
- 23 Capital St
- 23 Capital St Unit 1
- 644 Main St
- 27 Capital St
- 27 Capital St Unit 2
- 665 Main St
- 29 Capital St Unit 4
Your Personal Tour Guide
Ask me questions while you tour the home.