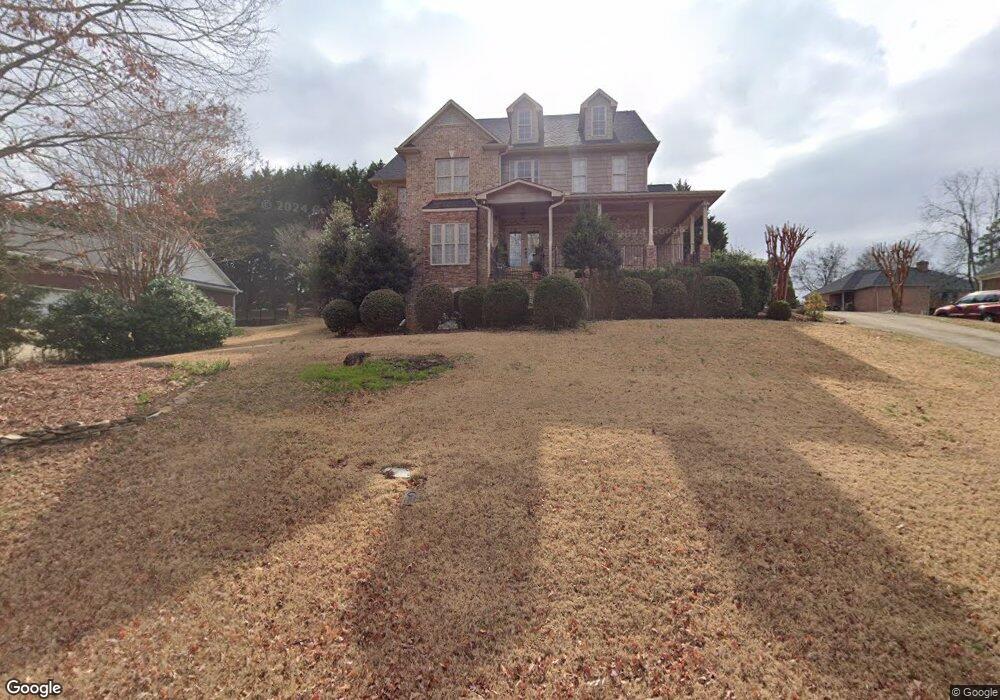
653 Mount Vernon Ln Duncan, SC 29334
Estimated Value: $602,033 - $633,000
4
Beds
4
Baths
3,700
Sq Ft
$166/Sq Ft
Est. Value
About This Home
This home is located at 653 Mount Vernon Ln, Duncan, SC 29334 and is currently estimated at $614,758, approximately $166 per square foot. 653 Mount Vernon Ln is a home located in Spartanburg County with nearby schools including River Ridge Elementary School, Florence Chapel Middle School, and Byrnes Freshman Academy.
Ownership History
Date
Name
Owned For
Owner Type
Purchase Details
Closed on
Feb 24, 2011
Sold by
Federal Home Loan Mortgage Corporation
Bought by
Basong Sherman
Current Estimated Value
Home Financials for this Owner
Home Financials are based on the most recent Mortgage that was taken out on this home.
Original Mortgage
$278,550
Outstanding Balance
$189,971
Interest Rate
4.71%
Mortgage Type
New Conventional
Estimated Equity
$424,787
Purchase Details
Closed on
Jun 24, 2010
Sold by
Dupree Ernest and Dupree Sheila G
Bought by
Federal Home Loan Mortgage Corp
Purchase Details
Closed on
Jun 3, 2005
Sold by
Weizenecker Homes Inc
Bought by
Dupree Ernest and Dupree Sheila G
Home Financials for this Owner
Home Financials are based on the most recent Mortgage that was taken out on this home.
Original Mortgage
$418,368
Interest Rate
5.66%
Mortgage Type
Future Advance Clause Open End Mortgage
Create a Home Valuation Report for This Property
The Home Valuation Report is an in-depth analysis detailing your home's value as well as a comparison with similar homes in the area
Home Values in the Area
Average Home Value in this Area
Purchase History
| Date | Buyer | Sale Price | Title Company |
|---|---|---|---|
| Basong Sherman | $309,500 | -- | |
| Federal Home Loan Mortgage Corp | $315,000 | -- | |
| Dupree Ernest | $393,600 | -- |
Source: Public Records
Mortgage History
| Date | Status | Borrower | Loan Amount |
|---|---|---|---|
| Open | Basong Sherman | $278,550 | |
| Previous Owner | Dupree Ernest | $418,368 |
Source: Public Records
Tax History
| Year | Tax Paid | Tax Assessment Tax Assessment Total Assessment is a certain percentage of the fair market value that is determined by local assessors to be the total taxable value of land and additions on the property. | Land | Improvement |
|---|---|---|---|---|
| 2022 | $2,431 | $15,194 | $1,777 | $13,417 |
| 2021 | $2,431 | $15,194 | $1,777 | $13,417 |
| 2020 | $2,392 | $15,194 | $1,777 | $13,417 |
| 2019 | $2,386 | $15,194 | $1,777 | $13,417 |
| 2018 | $2,276 | $15,194 | $1,777 | $13,417 |
| 2017 | $1,959 | $13,212 | $1,800 | $11,412 |
| 2016 | $1,888 | $13,212 | $1,800 | $11,412 |
| 2015 | $1,610 | $11,524 | $1,800 | $9,724 |
| 2014 | $1,617 | $11,524 | $1,800 | $9,724 |
Source: Public Records
Map
Nearby Homes
- 652 Mount Vernon Ln
- 770 Charleston Place
- 470 Drayton Hall Blvd
- 104 W Stableford Dr
- 237 Penick Dr
- 802 Morning Fog Dr
- 756 Windward Ln
- 150 Santa Ana Way
- 662 Windward Ln
- 131 Santa Ana Way
- 6046 Reidville Rd
- 749 W Tara Ln
- 1008 Zinfandel Way
- 1305 S Pinot Rd
- 1301 S Pinot Rd
- 1113 Syrah Ln
- 1208 N Pinot Rd
- 1216 N Pinot Rd
- 111 River Ridge Dr
- 734 Terrace Creek Dr
- 667 Mount Vernon Ln
- 647 Mount Vernon Ln
- 657 Mount Vernon Ln
- 656 Mount Vernon Ln
- 360 Old South Rd
- 661 Mount Vernon Ln
- 660 Mount Vernon Ln
- 648 Mount Vernon Ln
- 643 Mount Vernon Ln
- 350 Old South Rd
- 665 Mount Vernon Ln
- 364 Old Rd S
- 350 Old Rd S
- 364 Old South Rd
- 644 Mount Vernon Ln
- 664 Mount Vernon Ln
- 406 Old Rd S
- 640 Mount Vernon Ln
- 669 Mount Vernon Ln
- 639 Mount Vernon Ln
Your Personal Tour Guide
Ask me questions while you tour the home.