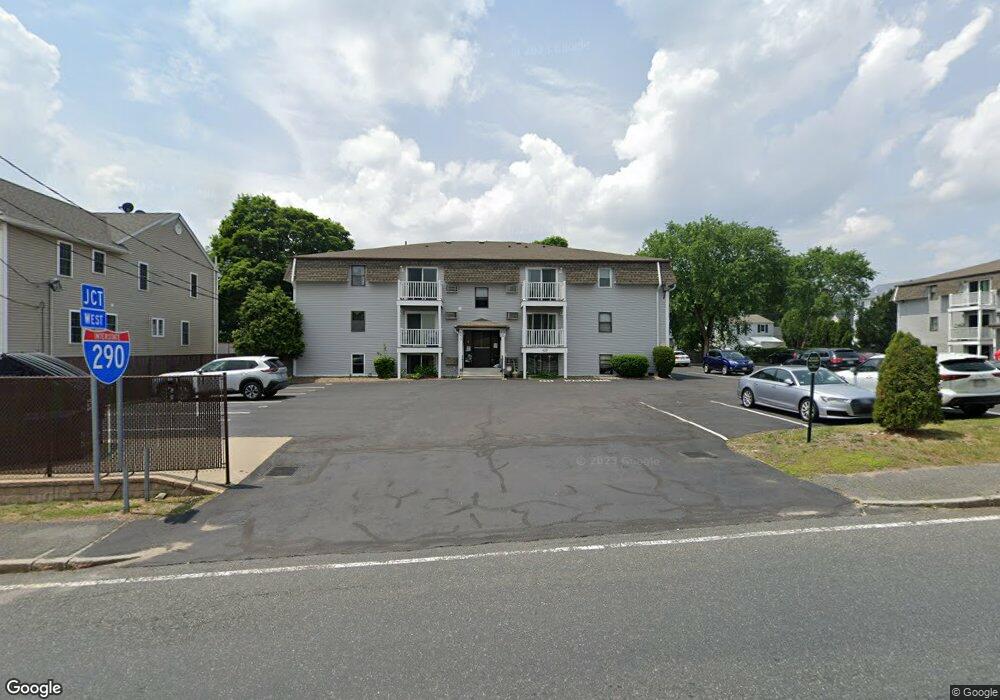
653 Plantation St Unit 21 Worcester, MA 01605
Estimated Value: $252,000 - $274,000
2
Beds
1
Bath
962
Sq Ft
$275/Sq Ft
Est. Value
About This Home
This home is located at 653 Plantation St Unit 21, Worcester, MA 01605 and is currently estimated at $264,238, approximately $274 per square foot. 653 Plantation St Unit 21 is a home located in Worcester County with nearby schools including Jacob Hiatt Magnet School, Chandler Magnet, and Lincoln Street School.
Ownership History
Date
Name
Owned For
Owner Type
Purchase Details
Closed on
Aug 16, 2018
Sold by
Boss Ronald J
Bought by
Konadu Nana A
Current Estimated Value
Home Financials for this Owner
Home Financials are based on the most recent Mortgage that was taken out on this home.
Original Mortgage
$123,976
Outstanding Balance
$107,668
Interest Rate
4.5%
Mortgage Type
New Conventional
Estimated Equity
$156,570
Purchase Details
Closed on
Apr 16, 2008
Sold by
Caires Sandra E
Bought by
Boss Ronald J
Home Financials for this Owner
Home Financials are based on the most recent Mortgage that was taken out on this home.
Original Mortgage
$85,500
Interest Rate
6.1%
Mortgage Type
Purchase Money Mortgage
Purchase Details
Closed on
Oct 9, 2001
Sold by
Ricahrds Craig G and Richards Rose A
Bought by
Caires Sandra E
Home Financials for this Owner
Home Financials are based on the most recent Mortgage that was taken out on this home.
Original Mortgage
$49,500
Interest Rate
6.89%
Mortgage Type
Purchase Money Mortgage
Create a Home Valuation Report for This Property
The Home Valuation Report is an in-depth analysis detailing your home's value as well as a comparison with similar homes in the area
Purchase History
| Date | Buyer | Sale Price | Title Company |
|---|---|---|---|
| Konadu Nana A | $129,561 | -- | |
| Boss Ronald J | $95,000 | -- | |
| Boss Ronald J | $95,000 | -- | |
| Caires Sandra E | $55,000 | -- |
Source: Public Records
Mortgage History
| Date | Status | Borrower | Loan Amount |
|---|---|---|---|
| Open | Konadu Nana A | $123,976 | |
| Previous Owner | Boss Ronald J | $85,500 | |
| Previous Owner | Caires Sandra E | $49,500 |
Source: Public Records
Tax History
| Year | Tax Paid | Tax Assessment Tax Assessment Total Assessment is a certain percentage of the fair market value that is determined by local assessors to be the total taxable value of land and additions on the property. | Land | Improvement |
|---|---|---|---|---|
| 2025 | $2,689 | $203,900 | $0 | $203,900 |
| 2024 | $2,635 | $191,600 | $0 | $191,600 |
| 2023 | $2,347 | $163,700 | $0 | $163,700 |
| 2022 | $2,066 | $135,800 | $0 | $135,800 |
| 2021 | $2,037 | $125,100 | $0 | $125,100 |
| 2020 | $1,972 | $116,000 | $0 | $116,000 |
| 2019 | $1,453 | $80,700 | $0 | $80,700 |
| 2018 | $1,424 | $75,300 | $0 | $75,300 |
| 2017 | $1,442 | $75,000 | $0 | $75,000 |
| 2016 | $2,133 | $103,500 | $0 | $103,500 |
| 2015 | $2,077 | $103,500 | $0 | $103,500 |
| 2014 | $2,022 | $103,500 | $0 | $103,500 |
Source: Public Records
Map
Nearby Homes
- 655 Plantation St Unit 20B
- 22 Huron Ave
- 39 Bullard Ave
- 12 Erie Ave
- 91-93 Natural History Dr
- 17 Goucher Ave
- 64 Wauwinet Rd
- 3205 Halcyon Dr Unit 3205
- 45 Goldthwaite Rd
- 29 Dominion Rd
- 190 Dominion Rd
- 7 Eaglehead Terrace Unit 6
- 58 Osceola Ave
- 40 Phillips Ave
- 2 Selden St
- 30 Melrose St
- 13 Fatima Ln
- 5 Ridge Rd
- 2 Poe Ave Unit 1
- 4 Poe Ave Unit 1
- 653 Plantation St Unit 10A
- 653 Plantation St Unit 24
- 653 Plantation St Unit 23
- 653 Plantation St Unit 22
- 653 Plantation St Unit 20
- 653 Plantation St Unit 19
- 653 Plantation St Unit 18
- 653 Plantation St Unit 17
- 653 Plantation St Unit 16
- 653 Plantation St Unit 15
- 653 Plantation St Unit 14
- 653 Plantation St Unit 13
- 653 Plantation St Unit 6A
- 653 Plantation St Unit 4A
- 653 Plantation St Unit 11A
- 653 Plantation St Unit 3RD - 10A
- 653 Plantation St Unit A5
- 653 Plantation St Unit 7A
- 653 Plantation St Unit A3
- 653 Plantation St Unit 6A,653
Your Personal Tour Guide
Ask me questions while you tour the home.