Estimated Value: $157,000 - $201,000
3
Beds
2
Baths
1,248
Sq Ft
$138/Sq Ft
Est. Value
About This Home
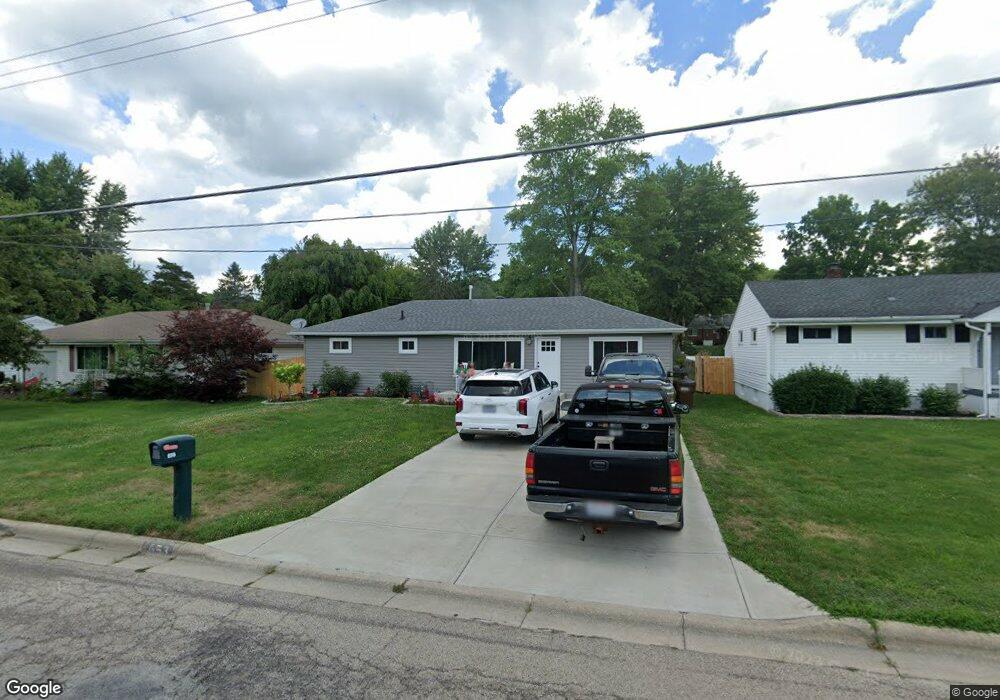
This home is located at 653 S Columbus St, Xenia, OH 45385 and is currently estimated at $172,784, approximately $138 per square foot. 653 S Columbus St is a home located in Greene County with nearby schools including Xenia High School, Summit Academy Community School for Alternative Learners - Xenia, and Legacy Christian Academy.
Ownership History
Date
Name
Owned For
Owner Type
Purchase Details
Closed on
Feb 14, 2019
Sold by
Rivera Ciro and Rivera Teresa
Bought by
Peterson Miranda and Peterson Jeffrey
Current Estimated Value
Home Financials for this Owner
Home Financials are based on the most recent Mortgage that was taken out on this home.
Original Mortgage
$61,200
Outstanding Balance
$39,195
Interest Rate
4.4%
Mortgage Type
New Conventional
Estimated Equity
$133,589
Purchase Details
Closed on
Dec 10, 1999
Sold by
Hud
Bought by
Rivera Ciro and Rivera Teresa
Home Financials for this Owner
Home Financials are based on the most recent Mortgage that was taken out on this home.
Original Mortgage
$40,945
Interest Rate
7.69%
Purchase Details
Closed on
May 21, 1999
Sold by
Gulley Natalie J
Bought by
Hud
Purchase Details
Closed on
May 11, 1999
Sold by
Gulley Natalie J and Doe John
Bought by
Hud
Purchase Details
Closed on
Jun 28, 1991
Bought by
Rivera Ciro and Rivera Rivera
Create a Home Valuation Report for This Property
The Home Valuation Report is an in-depth analysis detailing your home's value as well as a comparison with similar homes in the area
Home Values in the Area
Average Home Value in this Area
Purchase History
| Date | Buyer | Sale Price | Title Company |
|---|---|---|---|
| Peterson Miranda | $76,500 | First Ohio Title Insurance | |
| Rivera Ciro | $43,100 | -- | |
| Hud | $40,000 | -- | |
| Hud | $40,000 | -- | |
| Rivera Ciro | $58,900 | -- |
Source: Public Records
Mortgage History
| Date | Status | Borrower | Loan Amount |
|---|---|---|---|
| Open | Peterson Miranda | $61,200 | |
| Closed | Rivera Ciro | $40,945 |
Source: Public Records
Tax History Compared to Growth
Tax History
| Year | Tax Paid | Tax Assessment Tax Assessment Total Assessment is a certain percentage of the fair market value that is determined by local assessors to be the total taxable value of land and additions on the property. | Land | Improvement |
|---|---|---|---|---|
| 2024 | $1,696 | $35,770 | $9,820 | $25,950 |
| 2023 | $1,696 | $35,770 | $9,820 | $25,950 |
| 2022 | $1,375 | $26,300 | $6,550 | $19,750 |
| 2021 | $1,392 | $26,300 | $6,550 | $19,750 |
| 2020 | $1,336 | $26,300 | $6,550 | $19,750 |
| 2019 | $1,458 | $26,230 | $6,860 | $19,370 |
| 2018 | $1,463 | $26,230 | $6,860 | $19,370 |
| 2017 | $1,424 | $26,230 | $6,860 | $19,370 |
| 2016 | $1,411 | $24,860 | $6,860 | $18,000 |
| 2015 | $1,414 | $24,860 | $6,860 | $18,000 |
| 2014 | $1,358 | $24,860 | $6,860 | $18,000 |
Source: Public Records
Map
Nearby Homes
- 637 S Columbus St
- 661 S Columbus St
- 677 S Columbus St
- 622 Eavey St
- 634 Eavey St
- 608 Eavey St
- 660 S Columbus St
- 596 Eavey St
- 648 Eavey St
- 689 S Columbus St
- 609 S Columbus St
- 668 S Columbus St
- 0 Lavelle Dr
- 3 Lavelle Dr
- 3 Lavelle Dr
- 584 Eavey St
- 680 S Columbus St
- 614 Murray Hill Dr
- 597 S Columbus St
- 688 S Columbus St