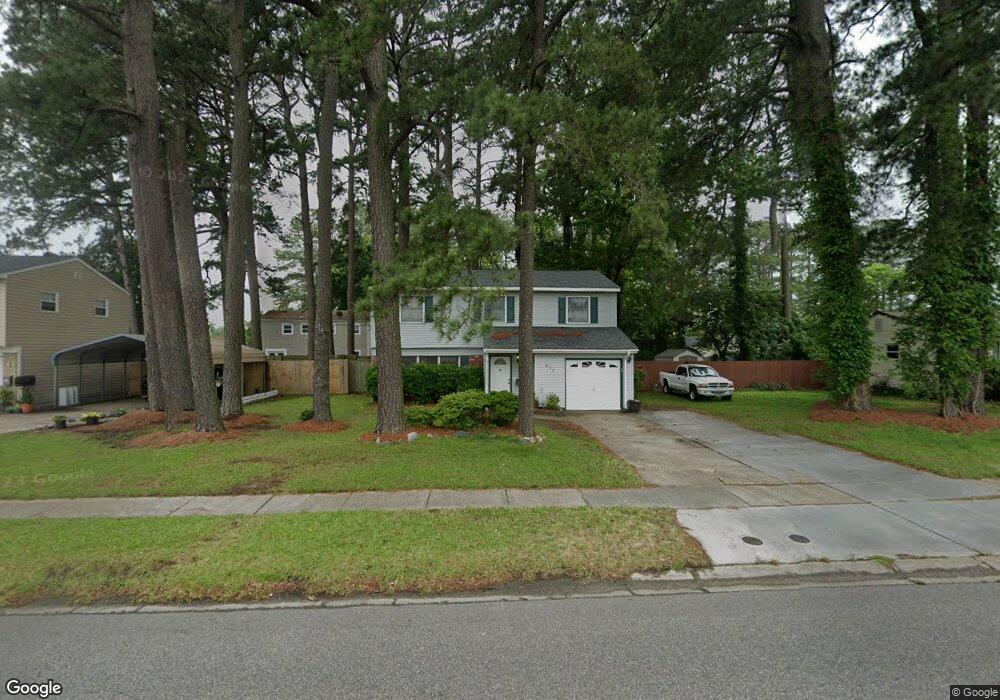
653 S Lynnhaven Rd Virginia Beach, VA 23452
Bow Creek NeighborhoodEstimated Value: $310,000 - $357,000
4
Beds
2
Baths
1,632
Sq Ft
$208/Sq Ft
Est. Value
About This Home
This home is located at 653 S Lynnhaven Rd, Virginia Beach, VA 23452 and is currently estimated at $338,933, approximately $207 per square foot. 653 S Lynnhaven Rd is a home located in Virginia Beach City with nearby schools including Brookwood Elementary School, Corporate Landing Middle School, and Ocean Lakes High School.
Ownership History
Date
Name
Owned For
Owner Type
Purchase Details
Closed on
Nov 10, 2021
Sold by
Barret Jordan J and Barret Karen L
Bought by
Legaz Matthew Evan
Current Estimated Value
Home Financials for this Owner
Home Financials are based on the most recent Mortgage that was taken out on this home.
Original Mortgage
$254,727
Outstanding Balance
$233,413
Interest Rate
2.99%
Mortgage Type
VA
Estimated Equity
$105,520
Purchase Details
Closed on
Sep 14, 2010
Sold by
Lembke Timothy A
Bought by
Barrett Karen L
Home Financials for this Owner
Home Financials are based on the most recent Mortgage that was taken out on this home.
Original Mortgage
$209,305
Interest Rate
4.51%
Mortgage Type
VA
Purchase Details
Closed on
May 21, 2002
Sold by
Sullivan Nicholas
Bought by
Lembke Timothy
Home Financials for this Owner
Home Financials are based on the most recent Mortgage that was taken out on this home.
Original Mortgage
$116,127
Interest Rate
7%
Mortgage Type
FHA
Create a Home Valuation Report for This Property
The Home Valuation Report is an in-depth analysis detailing your home's value as well as a comparison with similar homes in the area
Home Values in the Area
Average Home Value in this Area
Purchase History
| Date | Buyer | Sale Price | Title Company |
|---|---|---|---|
| Legaz Matthew Evan | $249,000 | Fidelity National Ttl Ins Co | |
| Barrett Karen L | $204,900 | -- | |
| Lembke Timothy | $117,950 | -- |
Source: Public Records
Mortgage History
| Date | Status | Borrower | Loan Amount |
|---|---|---|---|
| Open | Legaz Matthew Evan | $254,727 | |
| Previous Owner | Barrett Karen L | $209,305 | |
| Previous Owner | Lembke Timothy | $116,127 |
Source: Public Records
Tax History Compared to Growth
Tax History
| Year | Tax Paid | Tax Assessment Tax Assessment Total Assessment is a certain percentage of the fair market value that is determined by local assessors to be the total taxable value of land and additions on the property. | Land | Improvement |
|---|---|---|---|---|
| 2025 | $2,675 | $288,900 | $129,000 | $159,900 |
| 2024 | $2,675 | $275,800 | $115,000 | $160,800 |
| 2023 | $2,634 | $266,100 | $111,000 | $155,100 |
| 2022 | $2,478 | $250,300 | $111,000 | $139,300 |
| 2021 | $2,098 | $211,900 | $88,000 | $123,900 |
| 2020 | $2,065 | $202,900 | $80,000 | $122,900 |
| 2019 | $2,052 | $192,000 | $80,000 | $112,000 |
| 2018 | $1,925 | $192,000 | $80,000 | $112,000 |
| 2017 | $1,937 | $193,200 | $72,500 | $120,700 |
| 2016 | $1,913 | $193,200 | $72,500 | $120,700 |
| 2015 | $1,851 | $187,000 | $78,800 | $108,200 |
| 2014 | $1,734 | $176,100 | $84,000 | $92,100 |
Source: Public Records
Map
Nearby Homes
- 701 S Lynnhaven Rd
- 725 Burgesses Ln
- 705 Coach House Ct
- 3117 Coach House Ln
- 733 Lamplight Ln
- 3073 Pewter Rd
- 3016 Cobblestone Dr
- 301 Bethune Dr
- 3217 Deer Park Dr
- 3256 Deer Park Dr
- 816 Holly Hedge Ave
- 3284 Skipper Dr
- 2955 Talon Ct
- 3213 Burnt Mill Rd
- 502 Pheasant Run
- 662 Rivers Reach
- 413 Cameron Ln
- 635 Rivers Reach
- 694 Rivers Reach
- 720 Fox Run Rd
- 649 S Lynnhaven Rd
- 657 S Lynnhaven Rd
- 652 Carriage Hill Rd
- 648 Carriage Hill Rd
- 656 Carriage Hill Rd
- 645 S Lynnhaven Rd
- 661 S Lynnhaven Rd
- 644 Carriage Hill Rd
- 660 Carriage Hill Rd
- 641 S Lynnhaven Rd
- 665 S Lynnhaven Rd
- 664 Carriage Hill Rd
- 640 Carriage Hill Rd
- 3009 Ferry Farm Ln
- 669 S Lynnhaven Rd
- 668 Carriage Hill Rd
- 3000 Homespun Ave
- 3013 Ferry Farm Ln
- 3004 Homespun Ave
- 3008 Bowling Green Dr