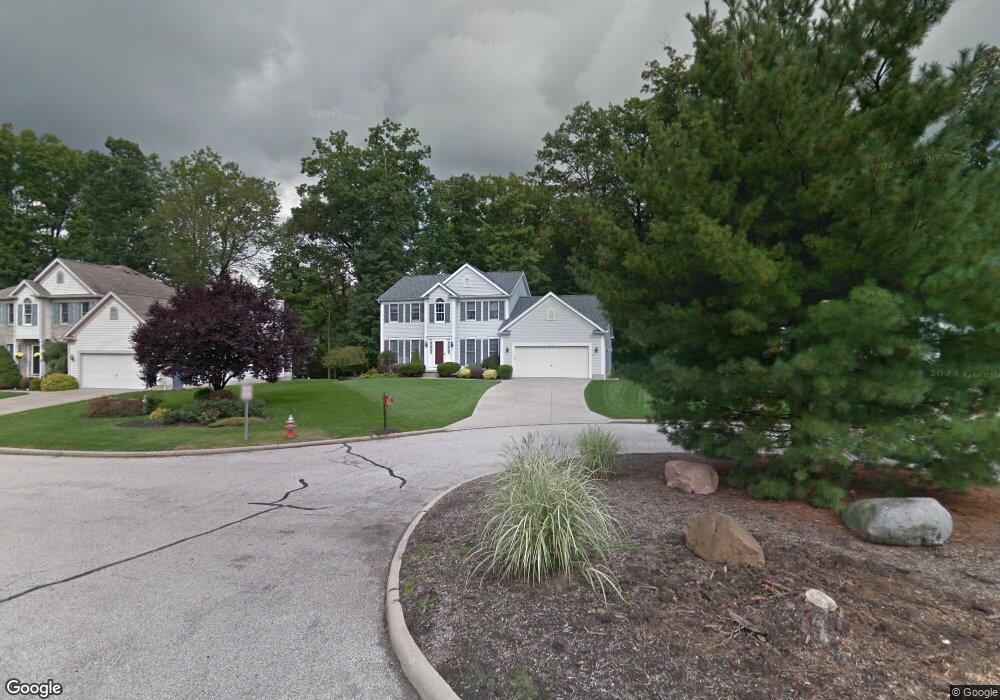
653 Timbercreek Rd Northfield, OH 44067
Estimated Value: $415,165 - $499,000
3
Beds
4
Baths
2,078
Sq Ft
$218/Sq Ft
Est. Value
About This Home
This home is located at 653 Timbercreek Rd, Northfield, OH 44067 and is currently estimated at $453,041, approximately $218 per square foot. 653 Timbercreek Rd is a home located in Summit County with nearby schools including Lee Eaton Elementary School, Nordonia Middle School, and Nordonia High School.
Ownership History
Date
Name
Owned For
Owner Type
Purchase Details
Closed on
Oct 28, 2004
Sold by
Guerini David F and Guerini Jody L
Bought by
Fuller Geoffrey R and Ogle Betty J
Current Estimated Value
Home Financials for this Owner
Home Financials are based on the most recent Mortgage that was taken out on this home.
Original Mortgage
$219,600
Outstanding Balance
$110,098
Interest Rate
5.85%
Mortgage Type
Purchase Money Mortgage
Estimated Equity
$342,943
Purchase Details
Closed on
Nov 7, 1997
Sold by
Hershberger John
Bought by
Guerini David F and Guerini Jody L
Home Financials for this Owner
Home Financials are based on the most recent Mortgage that was taken out on this home.
Original Mortgage
$170,550
Interest Rate
7.42%
Mortgage Type
New Conventional
Purchase Details
Closed on
Jan 10, 1997
Sold by
Greenwood Trading Corp
Bought by
Hersh Const Inc
Create a Home Valuation Report for This Property
The Home Valuation Report is an in-depth analysis detailing your home's value as well as a comparison with similar homes in the area
Home Values in the Area
Average Home Value in this Area
Purchase History
| Date | Buyer | Sale Price | Title Company |
|---|---|---|---|
| Fuller Geoffrey R | $274,500 | Gateway Title Agency Inc | |
| Guerini David F | $213,225 | -- | |
| Hersh Const Inc | $106,000 | -- |
Source: Public Records
Mortgage History
| Date | Status | Borrower | Loan Amount |
|---|---|---|---|
| Open | Fuller Geoffrey R | $219,600 | |
| Previous Owner | Guerini David F | $170,550 | |
| Closed | Fuller Geoffrey R | $27,450 |
Source: Public Records
Tax History
| Year | Tax Paid | Tax Assessment Tax Assessment Total Assessment is a certain percentage of the fair market value that is determined by local assessors to be the total taxable value of land and additions on the property. | Land | Improvement |
|---|---|---|---|---|
| 2024 | $6,371 | $125,850 | $23,489 | $102,361 |
| 2023 | $6,371 | $125,850 | $23,489 | $102,361 |
| 2022 | $6,069 | $97,111 | $18,067 | $79,044 |
| 2021 | $5,759 | $94,000 | $18,067 | $75,933 |
| 2020 | $5,665 | $94,000 | $18,070 | $75,930 |
| 2019 | $5,757 | $85,890 | $17,350 | $68,540 |
| 2018 | $5,072 | $85,890 | $17,350 | $68,540 |
| 2017 | $4,900 | $85,890 | $17,350 | $68,540 |
| 2016 | $4,851 | $80,490 | $17,350 | $63,140 |
| 2015 | $4,900 | $80,490 | $17,350 | $63,140 |
| 2014 | $4,870 | $80,490 | $17,350 | $63,140 |
| 2013 | $4,960 | $82,700 | $17,350 | $65,350 |
Source: Public Records
Map
Nearby Homes
- 920 Hemlock Ln Unit 920
- 732 Tinkers Ln
- 952 Hemlock Ln
- 940 Trimble Place
- 764 Hampton Ct Unit 764
- 798 Pipes Ct Unit 1605
- 804 Arboretum Cir Unit 804
- 911 Canyon View Rd Unit 112
- 6260 Greenwood Pkwy Unit 101
- 6290 Greenwood Pkwy Unit 302
- 419 Mcneil Dr
- 6270 Greenwood Pkwy Unit 302
- 6280 Greenwood Pkwy Unit 202
- 1115 Canyon View Rd Unit 504
- 1115 Canyon View Rd Unit 402
- 6340 Greenwood Pkwy Unit 405
- 1105 Canyon View #303 Rd
- 7357 Trailside Dr Unit C
- 9231 Olde 8 Rd
- 7861 N Gannett Rd
- 663 Timbercreek Rd
- 639 Timbercreek Rd
- 673 Timbercreek Rd
- 623 Timbercreek Rd
- 652 Timbercreek Rd
- 680 Rivendell Rd
- 662 Timbercreek Rd
- 670 Rivendell Rd
- 640 Timbercreek Rd
- 683 Timbercreek Rd
- 628 Timbercreek Rd
- 672 Timbercreek Rd
- 690 Rivendell Rd
- 682 Timbercreek Rd
- 675 Rivendell Rd
- 693 Timbercreek Rd
- 700 Rivendell Rd
- 692 Timbercreek Rd
- 679 Rivendell Rd
- 703 Timbercreek Rd
Your Personal Tour Guide
Ask me questions while you tour the home.