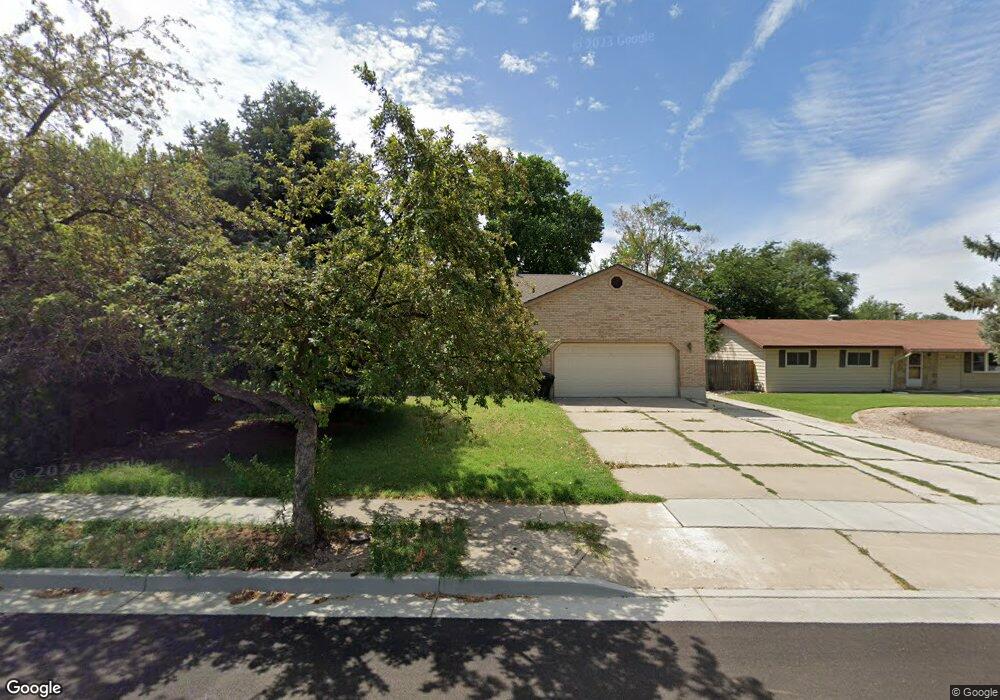
653 W 1300 N Clearfield, UT 84015
Estimated Value: $461,000 - $541,189
3
Beds
2
Baths
1,956
Sq Ft
$253/Sq Ft
Est. Value
About This Home
This home is located at 653 W 1300 N, Clearfield, UT 84015 and is currently estimated at $495,797, approximately $253 per square foot. 653 W 1300 N is a home located in Davis County with nearby schools including Clinton Elementary School, Sunset Junior High School, and Clearfield High School.
Ownership History
Date
Name
Owned For
Owner Type
Purchase Details
Closed on
Mar 7, 2008
Sold by
Davis Marilane S
Bought by
Kolovos George
Current Estimated Value
Purchase Details
Closed on
Jan 15, 2007
Sold by
Accord Properties Llc
Bought by
Davis Marilane S
Purchase Details
Closed on
Sep 28, 2006
Sold by
Mcelhaney Brian L and Mcelhaney Theresa
Bought by
Accord Properties Llc
Purchase Details
Closed on
Jun 9, 2006
Sold by
Tcif Re02 Llc
Bought by
Mcelhaney Brian and Mcelhaney Theresa
Purchase Details
Closed on
Apr 5, 2006
Sold by
Bradley Troy W and Bradley Margie V
Bought by
Tcif Re02 Llc
Purchase Details
Closed on
Sep 10, 1997
Sold by
Bush Michael L and Bush Dana
Bought by
Bradley Troy W and Bradley Margie
Home Financials for this Owner
Home Financials are based on the most recent Mortgage that was taken out on this home.
Original Mortgage
$101,500
Interest Rate
8.37%
Create a Home Valuation Report for This Property
The Home Valuation Report is an in-depth analysis detailing your home's value as well as a comparison with similar homes in the area
Home Values in the Area
Average Home Value in this Area
Purchase History
| Date | Buyer | Sale Price | Title Company |
|---|---|---|---|
| Kolovos George | -- | None Available | |
| Davis Marilane S | -- | Equity Title Ins Agency Inc | |
| Accord Properties Llc | -- | None Available | |
| Mcelhaney Brian | -- | First American Title | |
| Tcif Re02 Llc | $142,437 | First American Title | |
| Bradley Troy W | -- | Avis & Archibald Title Ins |
Source: Public Records
Mortgage History
| Date | Status | Borrower | Loan Amount |
|---|---|---|---|
| Previous Owner | Bradley Troy W | $101,500 | |
| Closed | Bradley Troy W | $25,350 |
Source: Public Records
Tax History Compared to Growth
Tax History
| Year | Tax Paid | Tax Assessment Tax Assessment Total Assessment is a certain percentage of the fair market value that is determined by local assessors to be the total taxable value of land and additions on the property. | Land | Improvement |
|---|---|---|---|---|
| 2025 | $2,837 | $272,800 | $155,000 | $117,800 |
| 2024 | $2,709 | $261,800 | $161,979 | $99,821 |
| 2023 | $2,555 | $457,000 | $199,217 | $257,783 |
| 2022 | $2,463 | $243,650 | $104,288 | $139,362 |
| 2021 | $2,180 | $320,000 | $161,122 | $158,878 |
| 2020 | $1,893 | $275,000 | $156,090 | $118,910 |
| 2019 | $1,867 | $265,000 | $148,146 | $116,854 |
| 2018 | $1,736 | $242,000 | $121,177 | $120,823 |
| 2016 | $1,526 | $109,835 | $50,681 | $59,154 |
| 2015 | $1,462 | $100,100 | $50,681 | $49,419 |
| 2014 | $1,232 | $85,653 | $50,681 | $34,972 |
| 2013 | -- | $107,601 | $36,263 | $71,338 |
Source: Public Records
Map
Nearby Homes