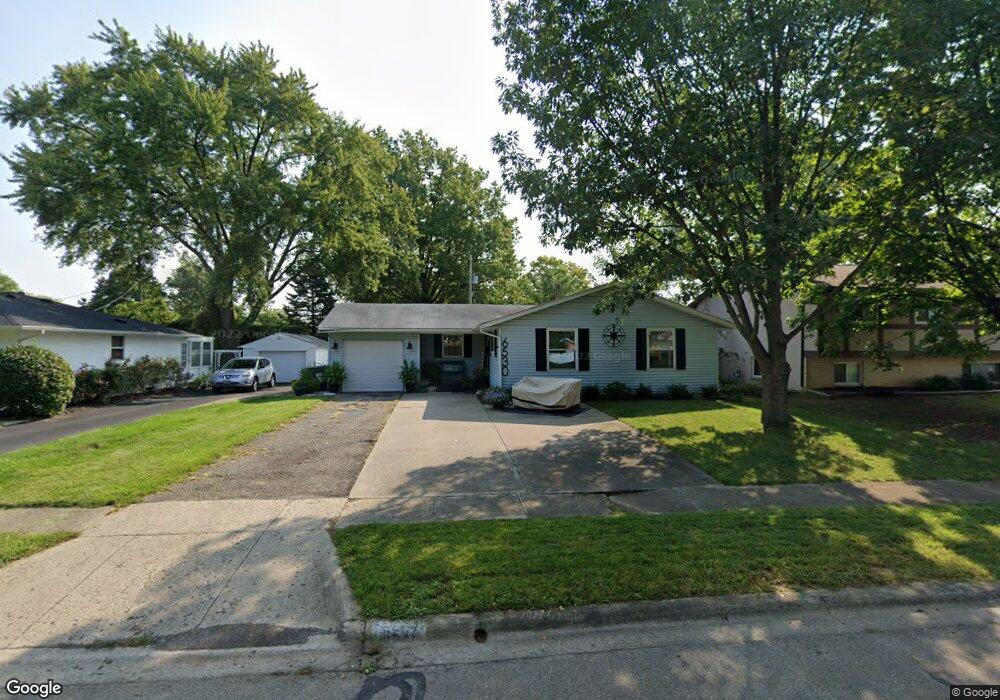
6530 Dobson Square W Columbus, OH 43229
Devonshire NeighborhoodEstimated Value: $200,000 - $254,000
3
Beds
1
Bath
1,096
Sq Ft
$212/Sq Ft
Est. Value
About This Home
This home is located at 6530 Dobson Square W, Columbus, OH 43229 and is currently estimated at $232,392, approximately $212 per square foot. 6530 Dobson Square W is a home located in Franklin County with nearby schools including Devonshire Alternative Elementary School, Woodward Park Middle School, and Beechcroft High School.
Ownership History
Date
Name
Owned For
Owner Type
Purchase Details
Closed on
Nov 18, 1999
Sold by
Associates Home Equity Services Inc
Bought by
Henry Brian L
Current Estimated Value
Home Financials for this Owner
Home Financials are based on the most recent Mortgage that was taken out on this home.
Original Mortgage
$69,300
Outstanding Balance
$21,399
Interest Rate
7.9%
Estimated Equity
$210,993
Purchase Details
Closed on
Sep 16, 1999
Sold by
Carder Richard L and Recinella Tina
Bought by
Associates Home Equity Services Inc and Ford Consumer Finance Company Inc
Purchase Details
Closed on
Aug 15, 1996
Sold by
Hault Richard I
Bought by
Recinella Richard L Carder and Recinella Tina
Home Financials for this Owner
Home Financials are based on the most recent Mortgage that was taken out on this home.
Original Mortgage
$75,708
Interest Rate
8.18%
Mortgage Type
New Conventional
Create a Home Valuation Report for This Property
The Home Valuation Report is an in-depth analysis detailing your home's value as well as a comparison with similar homes in the area
Home Values in the Area
Average Home Value in this Area
Purchase History
| Date | Buyer | Sale Price | Title Company |
|---|---|---|---|
| Henry Brian L | $77,000 | Hummel Title Agency Inc | |
| Associates Home Equity Services Inc | -- | Ohio Title Agency | |
| Recinella Richard L Carder | $79,900 | -- |
Source: Public Records
Mortgage History
| Date | Status | Borrower | Loan Amount |
|---|---|---|---|
| Open | Henry Brian L | $69,300 | |
| Previous Owner | Recinella Richard L Carder | $75,708 |
Source: Public Records
Tax History Compared to Growth
Tax History
| Year | Tax Paid | Tax Assessment Tax Assessment Total Assessment is a certain percentage of the fair market value that is determined by local assessors to be the total taxable value of land and additions on the property. | Land | Improvement |
|---|---|---|---|---|
| 2024 | $3,186 | $69,510 | $17,500 | $52,010 |
| 2023 | $3,146 | $69,510 | $17,500 | $52,010 |
| 2022 | $2,340 | $44,030 | $12,600 | $31,430 |
| 2021 | $2,344 | $44,030 | $12,600 | $31,430 |
| 2020 | $2,348 | $44,030 | $12,600 | $31,430 |
| 2019 | $2,166 | $34,830 | $10,080 | $24,750 |
| 2018 | $2,171 | $34,830 | $10,080 | $24,750 |
| 2017 | $2,048 | $34,830 | $10,080 | $24,750 |
| 2016 | $1,931 | $28,430 | $7,670 | $20,760 |
| 2015 | $1,758 | $28,430 | $7,670 | $20,760 |
| 2014 | $1,763 | $28,430 | $7,670 | $20,760 |
| 2013 | $966 | $31,570 | $8,505 | $23,065 |
Source: Public Records
Map
Nearby Homes
- 1421 Bosworth Place
- 6407 Faircrest Rd
- 1409 Bosworth Place
- 6458 Faircrest Rd
- 1635 Tendril Ct
- 6342 Bellmeadow Dr
- 1294 Clydesdale Ct
- 1322 Bolenhill Ct
- 1268 Kildale Ct
- 6407 Skywae Dr
- 1549 Alpine Dr
- 1288 Oakfield Dr N
- 1755 Hillandale Ave
- 6355 Johnanne St
- 6035 Karl Rd
- 6189 Northgap Dr
- 6496 Hearthstone Ave
- 6211 Parkdale Dr
- 6245 Sharon Woods Blvd
- 5990 Ambleside Dr
- 6522 Dobson Square W
- 6538 Dobson Square W
- 6525 Dobson Square E
- 6514 Dobson Square W
- 1483 Dobson Square N
- 6533 Dobson Square E
- 6517 Dobson Square E
- 6511 Dobson Square E
- 6533 Dobson Square W
- 1491 Dobson Square N
- 6525 Dobson Square W
- 6506 Dobson Square W
- 6541 Dobson Square W
- 6517 Dobson Square W
- 6549 Dobson Square W
- 6501 Dobson Square E
- 6498 Dobson Square W
- 1472 Dobson Square N
- 6509 Dobson Square W
- 6557 Dobson Square W