Estimated Value: $181,000 - $207,000
2
Beds
2
Baths
964
Sq Ft
$206/Sq Ft
Est. Value
About This Home
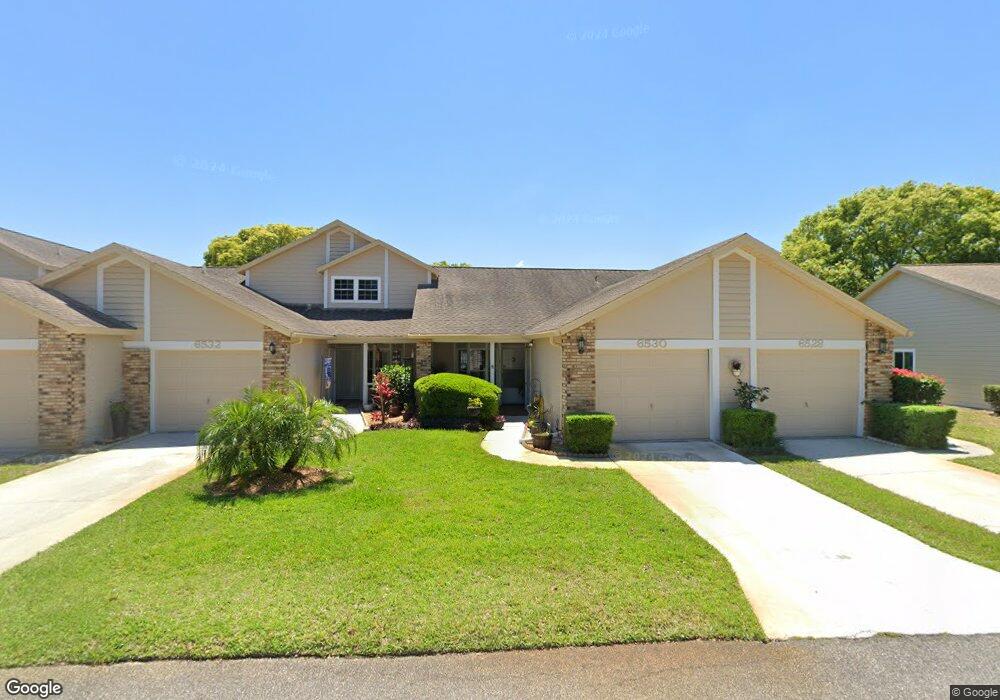
This home is located at 6530 Remus Dr, New Port Richey, FL 34653 and is currently estimated at $199,038, approximately $206 per square foot. 6530 Remus Dr is a home located in Pasco County with nearby schools including Cotee River Elementary School, Gulf Middle School, and Gulf High School.
Ownership History
Date
Name
Owned For
Owner Type
Purchase Details
Closed on
Jul 17, 2018
Sold by
Ancer Gary Michael and Boyle Albert Joseph
Bought by
Ancer Gary Michael and Boyle Albert Joseph
Current Estimated Value
Purchase Details
Closed on
Jan 12, 2018
Sold by
Mertz Patricia E
Bought by
Ancer Gary and Boyle Albert
Purchase Details
Closed on
May 25, 2012
Sold by
Starling Harvey G and Starling Priscilla M
Bought by
Ancer Gary M and Boyle Albert J
Home Financials for this Owner
Home Financials are based on the most recent Mortgage that was taken out on this home.
Original Mortgage
$48,602
Interest Rate
3.91%
Mortgage Type
FHA
Purchase Details
Closed on
May 31, 2005
Sold by
Savage Charles R
Bought by
Starling Harvey G and Starling Priscilla M
Home Financials for this Owner
Home Financials are based on the most recent Mortgage that was taken out on this home.
Original Mortgage
$90,000
Interest Rate
8.32%
Mortgage Type
New Conventional
Create a Home Valuation Report for This Property
The Home Valuation Report is an in-depth analysis detailing your home's value as well as a comparison with similar homes in the area
Home Values in the Area
Average Home Value in this Area
Purchase History
| Date | Buyer | Sale Price | Title Company |
|---|---|---|---|
| Ancer Gary Michael | -- | None Available | |
| Ancer Gary | -- | None Available | |
| Ancer Gary M | $49,500 | Keystone Title Agency Inc | |
| Starling Harvey G | $112,500 | Security First Title Partner |
Source: Public Records
Mortgage History
| Date | Status | Borrower | Loan Amount |
|---|---|---|---|
| Previous Owner | Ancer Gary M | $48,602 | |
| Previous Owner | Starling Harvey G | $90,000 | |
| Closed | Starling Harvey G | $22,500 |
Source: Public Records
Tax History Compared to Growth
Tax History
| Year | Tax Paid | Tax Assessment Tax Assessment Total Assessment is a certain percentage of the fair market value that is determined by local assessors to be the total taxable value of land and additions on the property. | Land | Improvement |
|---|---|---|---|---|
| 2025 | $3,673 | $194,025 | $20,582 | $173,443 |
| 2024 | $3,673 | $186,725 | $15,838 | $170,887 |
| 2023 | $3,305 | $120,970 | $0 | $0 |
| 2022 | $2,833 | $124,439 | $7,523 | $116,916 |
| 2021 | $2,597 | $107,624 | $6,757 | $100,867 |
| 2020 | $2,402 | $97,194 | $6,757 | $90,437 |
| 2019 | $2,182 | $82,638 | $6,757 | $75,881 |
| 2018 | $817 | $48,525 | $0 | $0 |
| 2017 | $803 | $48,525 | $0 | $0 |
| 2016 | $695 | $46,549 | $0 | $0 |
| 2015 | $697 | $46,225 | $0 | $0 |
| 2014 | $689 | $48,551 | $6,517 | $42,034 |
Source: Public Records
Map
Nearby Homes
- 6516 Remus Dr
- 6519 Thicket Trail
- 6506 Remus Dr
- 6505 Remus Dr
- 6514 Thicket Trail
- 6520 Thicket Trail
- 6432 Remus Dr
- 6428 Thicket Trail
- 6425 Thicket Trail
- 6424 Thicket Trail
- 6421 Remus Dr
- 6420 Cabbage Ln
- 4535 Uzzle Way
- 6440 Spring Flower Dr Unit 14
- 6440 Spring Flower Dr Unit 11
- 6519 Spring Flower Dr Unit 21
- 6604 Spring Flower Dr Unit 23
- 6424 Spring Flower Dr Unit 15
- 6307 Shane Ln
- 6410 Spring Flower Dr Unit 24
- 6532 Remus Dr
- 6528 Remus Dr
- 6534 Remus Dr
- 6524 Remus Dr
- 6536 Remus Dr
- 6522 Remus Dr
- 6531 Thicket Trail
- 6533 Thicket Trail
- 6520 Remus Dr
- 6538 Remus Dr
- 6535 Thicket Trail
- 6529 Remus Dr
- 6531 Remus Dr
- 6537 Thicket Trail
- 6533 Remus Dr
- 6525 Remus Dr
- 6535 Remus Dr
- 6521 Thicket Trail
- 6523 Remus Dr
- 6537 Remus Dr