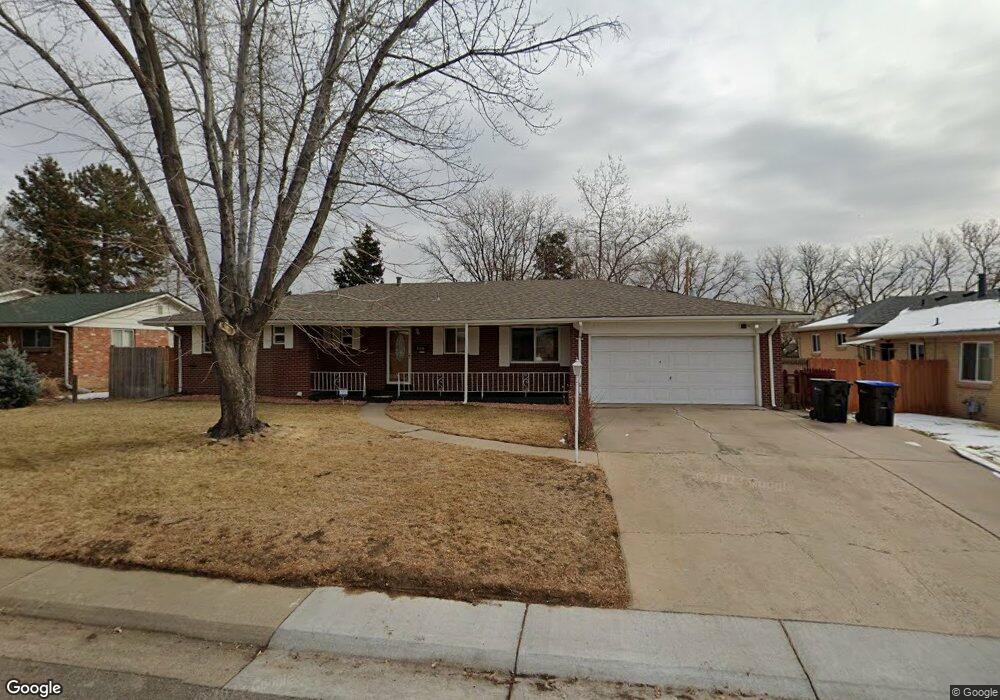
6530 Saulsbury Ct Arvada, CO 80003
Lamar Heights NeighborhoodEstimated Value: $640,718 - $675,000
5
Beds
3
Baths
2,758
Sq Ft
$238/Sq Ft
Est. Value
About This Home
This home is located at 6530 Saulsbury Ct, Arvada, CO 80003 and is currently estimated at $656,680, approximately $238 per square foot. 6530 Saulsbury Ct is a home located in Jefferson County with nearby schools including Secrest Elementary School, Chester W. Nimitz Middle School, and North Arvada Middle School.
Ownership History
Date
Name
Owned For
Owner Type
Purchase Details
Closed on
Dec 9, 2025
Sold by
Qiang Bethany
Bought by
Denny Kyle Sterling
Current Estimated Value
Purchase Details
Closed on
Dec 8, 2021
Sold by
Antwi Felix A
Bought by
Qiang Bethany and Denny Kyle Sterling
Home Financials for this Owner
Home Financials are based on the most recent Mortgage that was taken out on this home.
Original Mortgage
$576,000
Interest Rate
3.14%
Mortgage Type
New Conventional
Purchase Details
Closed on
Feb 29, 2008
Sold by
Brott Gary Lee and Brott Dalia T
Bought by
Antwi Felix A and Antwi Mavis
Home Financials for this Owner
Home Financials are based on the most recent Mortgage that was taken out on this home.
Original Mortgage
$254,406
Interest Rate
5.68%
Mortgage Type
FHA
Purchase Details
Closed on
Sep 8, 2006
Sold by
Throckmorton Richard M and Throckmorton Aletha Jeanne
Bought by
Brott Gary Lee and Brott Dalia T
Home Financials for this Owner
Home Financials are based on the most recent Mortgage that was taken out on this home.
Original Mortgage
$240,722
Interest Rate
6.72%
Mortgage Type
FHA
Create a Home Valuation Report for This Property
The Home Valuation Report is an in-depth analysis detailing your home's value as well as a comparison with similar homes in the area
Home Values in the Area
Average Home Value in this Area
Purchase History
| Date | Buyer | Sale Price | Title Company |
|---|---|---|---|
| Qiang Bethany | $607,000 | Land Title Guarantee Company | |
| Antwi Felix A | $258,000 | North American Title | |
| Brott Gary Lee | $244,500 | American Liberty Title |
Source: Public Records
Mortgage History
| Date | Status | Borrower | Loan Amount |
|---|---|---|---|
| Open | Qiang Bethany | $576,000 | |
| Previous Owner | Antwi Felix A | $254,406 | |
| Previous Owner | Brott Gary Lee | $240,722 |
Source: Public Records
Tax History Compared to Growth
Tax History
| Year | Tax Paid | Tax Assessment Tax Assessment Total Assessment is a certain percentage of the fair market value that is determined by local assessors to be the total taxable value of land and additions on the property. | Land | Improvement |
|---|---|---|---|---|
| 2024 | $3,708 | $38,229 | $16,403 | $21,826 |
| 2023 | $3,708 | $38,229 | $16,403 | $21,826 |
| 2022 | $2,994 | $30,577 | $13,653 | $16,924 |
| 2021 | $3,044 | $31,457 | $14,046 | $17,411 |
| 2020 | $2,691 | $27,887 | $8,273 | $19,614 |
| 2019 | $2,655 | $27,887 | $8,273 | $19,614 |
| 2018 | $2,532 | $25,859 | $6,926 | $18,933 |
| 2017 | $2,318 | $25,859 | $6,926 | $18,933 |
| 2016 | $2,142 | $22,251 | $6,657 | $15,594 |
| 2015 | $1,837 | $22,251 | $6,657 | $15,594 |
| 2014 | $1,837 | $18,141 | $5,731 | $12,410 |
Source: Public Records
Map
Nearby Homes
- 6555 Teller St
- 6721 Quay Ct
- 6537 Otis St
- 6204 Vance St
- 6781 Quay Ct
- 7365 W 61st Ave
- 6885 W 69th Place
- 8090 W 68th Ave
- 7021 Saulsbury St
- 6349 Ingalls St
- 6769 W 70th Ave
- 7555 W 69th Place
- 7049 Reed Ct
- 6581 Harlan St
- 6409 Brentwood St
- 6552 Harlan St
- 8233 W 62nd Place
- 7303 W 59th Ave
- 6007 Yarrow St Unit D
- 6480 W 60th Ave
- 6540 Saulsbury Ct
- 6513 Reed Ct
- 6503 Reed Ct
- 6510 Saulsbury Ct
- 6523 Reed Ct
- 6550 Saulsbury Ct
- 6473 Reed Ct
- 6531 Saulsbury Ct
- 6521 Saulsbury Ct
- 6545 Saulsbury Ct
- 6533 Reed Ct
- 6500 Saulsbury Ct
- 6463 Reed Ct
- 6511 Saulsbury Ct
- 6551 Saulsbury Ct
- 6560 Saulsbury Ct
- 6543 Reed Ct
- 6501 Saulsbury Ct
- 6561 Saulsbury Ct
- 6453 Reed Ct