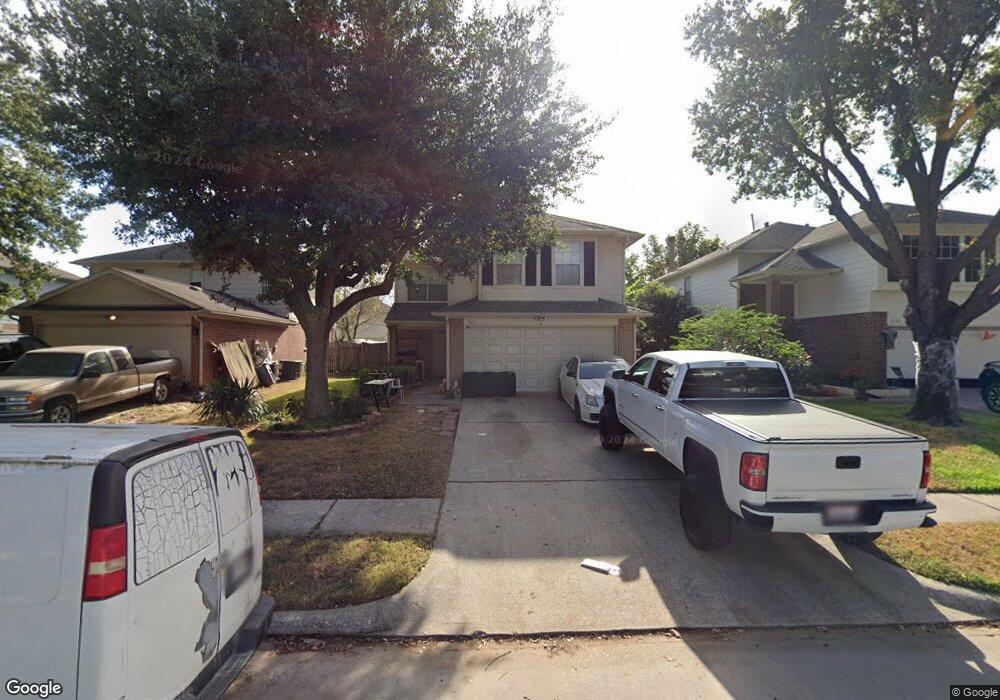
6531 Mccharen Ct Houston, TX 77086
North Houston NeighborhoodEstimated Value: $236,000 - $270,000
4
Beds
3
Baths
2,118
Sq Ft
$121/Sq Ft
Est. Value
About This Home
This home is located at 6531 Mccharen Ct, Houston, TX 77086 and is currently estimated at $255,291, approximately $120 per square foot. 6531 Mccharen Ct is a home located in Harris County with nearby schools including Kujawa EC/Pre-K/K School, Wilson Intermediate School, and Shotwell Middle School.
Ownership History
Date
Name
Owned For
Owner Type
Purchase Details
Closed on
Oct 17, 2008
Sold by
Nguyen Van H
Bought by
Nguyen Giong and Nguyen Tuyen
Current Estimated Value
Home Financials for this Owner
Home Financials are based on the most recent Mortgage that was taken out on this home.
Original Mortgage
$84,700
Outstanding Balance
$55,148
Interest Rate
6%
Mortgage Type
Stand Alone Refi Refinance Of Original Loan
Estimated Equity
$200,143
Purchase Details
Closed on
Dec 3, 2002
Sold by
Nguyen Steven T
Bought by
Nguyen Van H
Purchase Details
Closed on
Mar 23, 2000
Sold by
Kaufman & Broad Lone Star Lp
Bought by
Nguyen Steven and Nguyen Van H
Home Financials for this Owner
Home Financials are based on the most recent Mortgage that was taken out on this home.
Original Mortgage
$33,650
Interest Rate
8.33%
Create a Home Valuation Report for This Property
The Home Valuation Report is an in-depth analysis detailing your home's value as well as a comparison with similar homes in the area
Home Values in the Area
Average Home Value in this Area
Purchase History
| Date | Buyer | Sale Price | Title Company |
|---|---|---|---|
| Nguyen Giong | -- | Startex Title | |
| Nguyen Van H | -- | -- | |
| Nguyen Steven | -- | -- |
Source: Public Records
Mortgage History
| Date | Status | Borrower | Loan Amount |
|---|---|---|---|
| Open | Nguyen Giong | $84,700 | |
| Previous Owner | Nguyen Steven | $33,650 |
Source: Public Records
Tax History Compared to Growth
Tax History
| Year | Tax Paid | Tax Assessment Tax Assessment Total Assessment is a certain percentage of the fair market value that is determined by local assessors to be the total taxable value of land and additions on the property. | Land | Improvement |
|---|---|---|---|---|
| 2025 | $4,190 | $246,208 | $32,695 | $213,513 |
| 2024 | $4,190 | $253,321 | $32,695 | $220,626 |
| 2023 | $4,190 | $253,321 | $33,877 | $219,444 |
| 2022 | $4,815 | $228,476 | $26,059 | $202,417 |
| 2021 | $4,367 | $184,245 | $26,059 | $158,186 |
| 2020 | $4,413 | $181,594 | $26,059 | $155,535 |
| 2019 | $4,172 | $156,125 | $17,981 | $138,144 |
| 2018 | $1,581 | $141,062 | $17,981 | $123,081 |
| 2017 | $3,324 | $132,292 | $16,157 | $116,135 |
| 2016 | $3,022 | $132,292 | $16,157 | $116,135 |
| 2015 | $2,185 | $114,501 | $16,157 | $98,344 |
| 2014 | $2,185 | $98,080 | $16,157 | $81,923 |
Source: Public Records
Map
Nearby Homes
- 6622 Sutton Meadows Dr
- 6411 Halstead Meadows Cir
- 10730 Antoine Dr
- 6706 Redding Springs Ln
- 0 Tomball Pkwy
- 6703 Deer Ridge Ln
- 7011 Lower Arrow Dr
- 6830 Desert Rose Ln
- 12610 Twilight Bend Ct
- 10214 Trade Winds Dr
- 5914 Stirring Winds Ln
- 6606 Dusty Dawn Dr
- 9815 Lonsford Dr
- 6822 Dusty Dawn Dr
- 10306 Jillana Kaye Dr
- 00 Romona Blvd
- 3265 Frick Rd
- 6911 Silver Star Dr
- 12623 Ann Louise Rd
- 6502 Trail Valley Way
- 6527 Mccharen Ct
- 6535 Mccharen Ct
- 6523 Mccharen Ct
- 6539 Mccharen Ct
- 6530 Bryant Park Ct
- 6534 Bryant Park Ct
- 6526 Bryant Park Ct
- 6543 Mccharen Ct
- 6519 Mccharen Ct
- 6522 Bryant Park Ct
- 6538 Bryant Park Ct
- 6532 Mccharen Ct
- 6528 Mccharen Ct
- 6536 Mccharen Ct
- 6518 Bryant Park Ct
- 6524 Mccharen Ct
- 6542 Bryant Park Ct
- 6515 Mccharen Ct
- 6547 Mccharen Ct
- 6540 Mccharen Ct