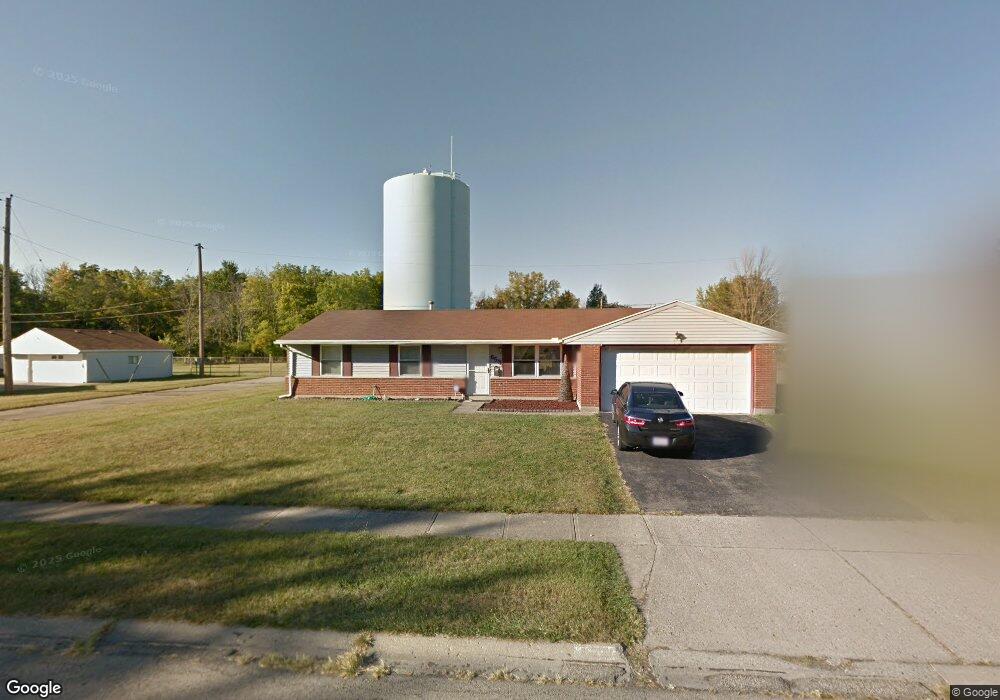
6531 Stonehurst Dr Dayton, OH 45424
Estimated Value: $198,011 - $212,000
3
Beds
2
Baths
1,266
Sq Ft
$162/Sq Ft
Est. Value
About This Home
This home is located at 6531 Stonehurst Dr, Dayton, OH 45424 and is currently estimated at $204,503, approximately $161 per square foot. 6531 Stonehurst Dr is a home located in Montgomery County with nearby schools including Wayne High School and Huber Heights Christian Academy.
Ownership History
Date
Name
Owned For
Owner Type
Purchase Details
Closed on
May 5, 2020
Sold by
Rice Jeffrey A and Rice Jarnie L
Bought by
Rethman Brian J
Current Estimated Value
Home Financials for this Owner
Home Financials are based on the most recent Mortgage that was taken out on this home.
Original Mortgage
$127,070
Outstanding Balance
$113,021
Interest Rate
3.5%
Mortgage Type
New Conventional
Estimated Equity
$91,482
Purchase Details
Closed on
Oct 3, 2003
Sold by
Swift Jeffrey C
Bought by
Rice Jeffrey A
Home Financials for this Owner
Home Financials are based on the most recent Mortgage that was taken out on this home.
Original Mortgage
$83,120
Interest Rate
6.23%
Mortgage Type
Purchase Money Mortgage
Purchase Details
Closed on
Sep 27, 1999
Sold by
Gamboa Emmanual D and Gamboa Sevilla C
Bought by
Swift Jeffrey C
Home Financials for this Owner
Home Financials are based on the most recent Mortgage that was taken out on this home.
Original Mortgage
$91,953
Interest Rate
7.93%
Mortgage Type
FHA
Create a Home Valuation Report for This Property
The Home Valuation Report is an in-depth analysis detailing your home's value as well as a comparison with similar homes in the area
Home Values in the Area
Average Home Value in this Area
Purchase History
| Date | Buyer | Sale Price | Title Company |
|---|---|---|---|
| Rethman Brian J | $131,000 | Tip | |
| Rice Jeffrey A | -- | -- | |
| Swift Jeffrey C | $92,000 | -- |
Source: Public Records
Mortgage History
| Date | Status | Borrower | Loan Amount |
|---|---|---|---|
| Open | Rethman Brian J | $127,070 | |
| Closed | Rice Jeffrey A | $83,120 | |
| Previous Owner | Swift Jeffrey C | $91,953 |
Source: Public Records
Tax History Compared to Growth
Tax History
| Year | Tax Paid | Tax Assessment Tax Assessment Total Assessment is a certain percentage of the fair market value that is determined by local assessors to be the total taxable value of land and additions on the property. | Land | Improvement |
|---|---|---|---|---|
| 2024 | $2,605 | $50,460 | $10,150 | $40,310 |
| 2023 | $2,605 | $50,460 | $10,150 | $40,310 |
| 2022 | $2,275 | $34,760 | $7,000 | $27,760 |
| 2021 | $2,311 | $34,760 | $7,000 | $27,760 |
| 2020 | $2,372 | $34,760 | $7,000 | $27,760 |
| 2019 | $2,311 | $30,730 | $7,000 | $23,730 |
| 2018 | $2,319 | $30,730 | $7,000 | $23,730 |
| 2017 | $2,304 | $30,730 | $7,000 | $23,730 |
| 2016 | $2,187 | $28,420 | $7,000 | $21,420 |
| 2015 | $2,159 | $28,420 | $7,000 | $21,420 |
| 2014 | $2,159 | $28,420 | $7,000 | $21,420 |
| 2012 | -- | $31,620 | $8,750 | $22,870 |
Source: Public Records
Map
Nearby Homes
- 6681 Spokane Dr
- 6701 Springport Way
- 7866 Harshmanville Rd
- 7854 Harshmanville Rd
- 7741 Shalamar Dr
- 7833 Harshmanville Rd
- 8282 Briar Ridge Ct
- 6605 Highbury Rd
- 7660 Stonecrest Dr
- 7371 Damascus Dr
- 6447 Highbury Rd
- 7611 Shepherdess Dr
- 7211 Stonehurst Dr
- 7011 Safari Dr
- 7221 Serpentine Dr
- 6652 Loblolly Dr
- 6960 Serene Place
- 6601 Grovehill Dr
- 6811 Highbury Rd
- 6150 Taylorsville Rd
- 6541 Stonehurst Dr
- 6501 Stonehurst Dr
- 6611 Stonehurst Dr
- 6530 Stonehurst Dr
- 6520 Stonehurst Dr
- 6510 Stonehurst Dr
- 6600 Stonehurst Dr
- 6467 Stonehurst Dr
- 6631 Stonehurst Dr
- 7780 Remmick Ln
- 7908 Sebring Dr
- 6640 Pegwood Ct
- 7771 Rothfield Dr
- 7761 Rothfield Dr
- 6639 Stonehurst Dr
- 6455 Stonehurst Dr
- 7770 Stonesboro Dr
- 7770 Remmick Ln
- 7781 Stockholm Dr
- 7751 Rothfield Dr