6532 NE Pine St Suquamish, WA 98392
Suquamish NeighborhoodEstimated Value: $354,000 - $382,000
2
Beds
1
Bath
788
Sq Ft
$473/Sq Ft
Est. Value
About This Home
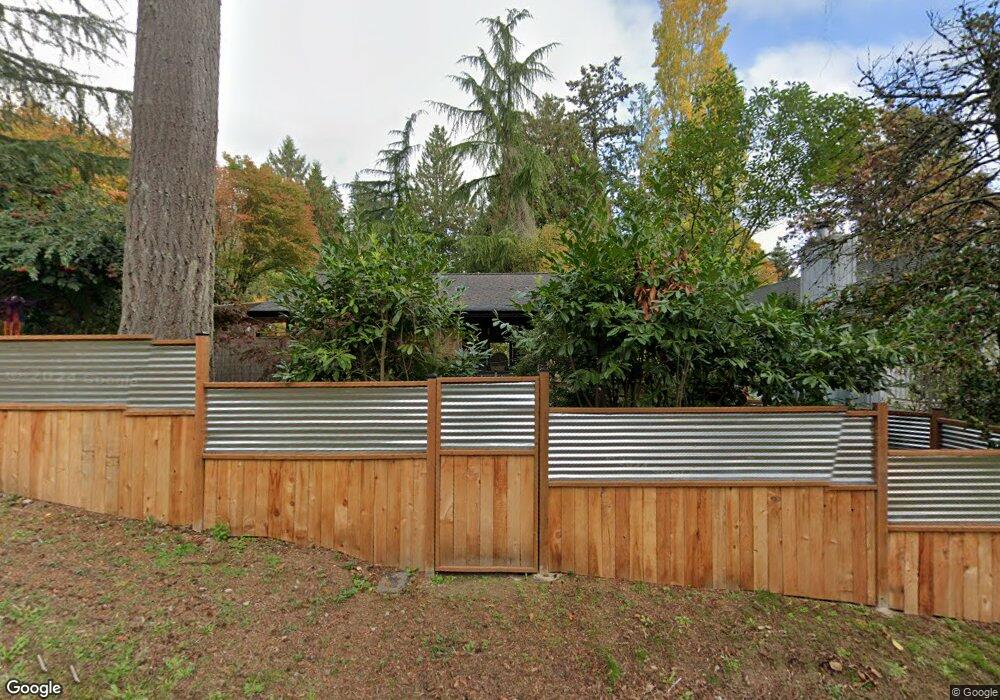
This home is located at 6532 NE Pine St, Suquamish, WA 98392 and is currently estimated at $372,395, approximately $472 per square foot. 6532 NE Pine St is a home located in Kitsap County with nearby schools including Suquamish Elementary School, Kingston Middle School, and Kingston High School.
Ownership History
Date
Name
Owned For
Owner Type
Purchase Details
Closed on
Apr 24, 2013
Sold by
Avery Ted A
Bought by
Avery Theodore A and Jones David H
Current Estimated Value
Home Financials for this Owner
Home Financials are based on the most recent Mortgage that was taken out on this home.
Original Mortgage
$180,000
Outstanding Balance
$127,801
Interest Rate
3.6%
Mortgage Type
New Conventional
Estimated Equity
$244,594
Purchase Details
Closed on
Nov 21, 2007
Sold by
Shahinian Edward M
Bought by
Avery Ted A
Home Financials for this Owner
Home Financials are based on the most recent Mortgage that was taken out on this home.
Original Mortgage
$184,500
Interest Rate
6.36%
Mortgage Type
Purchase Money Mortgage
Purchase Details
Closed on
Aug 25, 1995
Sold by
Pine Street Partners
Bought by
Avery Ted A and Shahinian Edward M
Home Financials for this Owner
Home Financials are based on the most recent Mortgage that was taken out on this home.
Original Mortgage
$83,600
Interest Rate
7.63%
Create a Home Valuation Report for This Property
The Home Valuation Report is an in-depth analysis detailing your home's value as well as a comparison with similar homes in the area
Home Values in the Area
Average Home Value in this Area
Purchase History
| Date | Buyer | Sale Price | Title Company |
|---|---|---|---|
| Avery Theodore A | -- | First American Title Ins | |
| Avery Ted A | -- | Transnation Title Ins Co | |
| Avery Ted A | $88,000 | Pioneer Title Co |
Source: Public Records
Mortgage History
| Date | Status | Borrower | Loan Amount |
|---|---|---|---|
| Open | Avery Theodore A | $180,000 | |
| Closed | Avery Ted A | $184,500 | |
| Previous Owner | Avery Ted A | $83,600 |
Source: Public Records
Tax History Compared to Growth
Tax History
| Year | Tax Paid | Tax Assessment Tax Assessment Total Assessment is a certain percentage of the fair market value that is determined by local assessors to be the total taxable value of land and additions on the property. | Land | Improvement |
|---|---|---|---|---|
| 2026 | $2,928 | $321,800 | $88,200 | $233,600 |
| 2025 | $2,928 | $321,800 | $88,200 | $233,600 |
| 2024 | $2,489 | $280,820 | $75,660 | $205,160 |
| 2023 | $2,527 | $280,820 | $75,660 | $205,160 |
| 2022 | $2,184 | $229,310 | $63,050 | $166,260 |
| 2021 | $2,105 | $202,150 | $54,320 | $147,830 |
| 2020 | $2,047 | $194,270 | $51,900 | $142,370 |
| 2019 | $1,940 | $184,040 | $48,500 | $135,540 |
| 2018 | $1,754 | $144,130 | $48,500 | $95,630 |
| 2017 | $1,734 | $144,130 | $48,500 | $95,630 |
| 2016 | $1,734 | $132,330 | $48,500 | $83,830 |
| 2015 | $1,720 | $132,330 | $48,500 | $83,830 |
| 2014 | -- | $129,380 | $48,500 | $80,880 |
| 2013 | -- | $129,380 | $48,500 | $80,880 |
Source: Public Records
Map
Nearby Homes
- 6712 NE Geneva St
- 18952 Brockton Ave NE
- 17711 Division Ave NE
- 6615 NE Maple St
- 18610 5th Ave NE
- 6705 NE Prospect St
- 18971 Soundview Blvd NE
- 18689 1st Ave NE
- 18872 Augusta Ave NE
- 19313 Harris Ave NE
- 17274 Angeline Ave NE
- 0 Augusta Ave NE Unit NWM2412417
- 17691 Division Ave NE
- 17655 Division Ave NE
- 17880 Purves Ave NE
- 7249 1&2 NE Pebble Beach Dr
- 19777 View Terrace NE
- 20695 Mainland View Ln NE
- 0 20+ac Sackman Ln NE
- 6341 NE Balzow Rd
- 6528 NE Pine St
- 6534 NE Pine St
- 6511 NE Geneva St
- 6523 NE Geneva St
- 6543 NE Pine St
- 6485 NE Geneva St
- 6479 NE Pine St
- 6560 NE Pine St
- 6450 NE Pine St
- 6540 NE Cedar St
- 6522 NE Cedar St
- 6500 NE Geneva St
- 18735 Brockton Ave NE
- 6520 NE Geneva St
- 6599 NE Geneva St
- 6599 NE Geneva St
- 6494 NE Cedar St
- 6455 NE Pine St
- 6598 NE Cedar St
- 6528 NE Cedar St