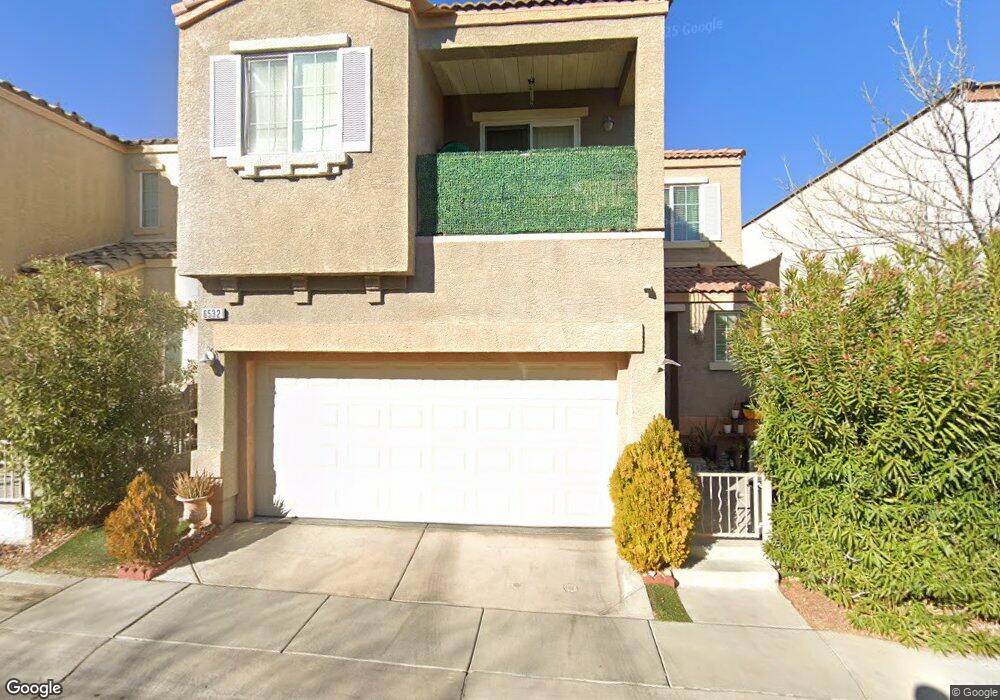
6532 Netherseal Ave Las Vegas, NV 89139
Coronado Ranch NeighborhoodEstimated Value: $367,000 - $387,000
3
Beds
3
Baths
1,493
Sq Ft
$251/Sq Ft
Est. Value
About This Home
This home is located at 6532 Netherseal Ave, Las Vegas, NV 89139 and is currently estimated at $375,204, approximately $251 per square foot. 6532 Netherseal Ave is a home located in Clark County with nearby schools including Tony Alamo Elementary School, Lawrence & Heidi Canarelli Middle School, and Sierra Vista High School.
Ownership History
Date
Name
Owned For
Owner Type
Purchase Details
Closed on
May 25, 2021
Sold by
Tornatore Thomas R
Bought by
Supnet Honorata and Supnet Jude
Current Estimated Value
Home Financials for this Owner
Home Financials are based on the most recent Mortgage that was taken out on this home.
Original Mortgage
$11,783
Outstanding Balance
$10,668
Interest Rate
2.9%
Mortgage Type
Unknown
Estimated Equity
$364,536
Purchase Details
Closed on
May 8, 2004
Sold by
Astoria Pinnacle Hd Llc
Bought by
Vial Tanya M
Home Financials for this Owner
Home Financials are based on the most recent Mortgage that was taken out on this home.
Original Mortgage
$152,950
Interest Rate
5.25%
Mortgage Type
New Conventional
Create a Home Valuation Report for This Property
The Home Valuation Report is an in-depth analysis detailing your home's value as well as a comparison with similar homes in the area
Home Values in the Area
Average Home Value in this Area
Purchase History
| Date | Buyer | Sale Price | Title Company |
|---|---|---|---|
| Supnet Honorata | $300,000 | Wfg National Title Compan | |
| Vial Tanya M | $191,215 | First American Title Co Of |
Source: Public Records
Mortgage History
| Date | Status | Borrower | Loan Amount |
|---|---|---|---|
| Open | Supnet Honorata | $11,783 | |
| Open | Supnet Honorata | $294,566 | |
| Previous Owner | Vial Tanya M | $152,950 | |
| Closed | Vial Tanya M | $28,650 |
Source: Public Records
Tax History Compared to Growth
Tax History
| Year | Tax Paid | Tax Assessment Tax Assessment Total Assessment is a certain percentage of the fair market value that is determined by local assessors to be the total taxable value of land and additions on the property. | Land | Improvement |
|---|---|---|---|---|
| 2025 | $1,393 | $92,014 | $28,000 | $64,014 |
| 2024 | $1,353 | $92,014 | $28,000 | $64,014 |
| 2023 | $1,104 | $85,818 | $25,550 | $60,268 |
| 2022 | $1,440 | $76,760 | $21,700 | $55,060 |
| 2021 | $1,334 | $73,675 | $21,350 | $52,325 |
| 2020 | $1,236 | $73,186 | $21,350 | $51,836 |
| 2019 | $1,200 | $68,422 | $17,500 | $50,922 |
| 2018 | $1,165 | $63,519 | $14,700 | $48,819 |
| 2017 | $1,849 | $62,776 | $13,650 | $49,126 |
| 2016 | $1,104 | $54,922 | $10,500 | $44,422 |
| 2015 | $1,101 | $47,217 | $8,400 | $38,817 |
| 2014 | $1,069 | $35,508 | $4,200 | $31,308 |
Source: Public Records
Map
Nearby Homes
- 6538 Netherseal Ave
- 6599 Netherseal Ave
- 7520 Fontera Ct
- 6635 Topley Pike Ave
- 7550 Jacaranda Bay St
- 6645 Churnet Valley Ave
- 7355 Lagoon Blue St
- 6677 Topley Pike Ave
- 6584 Cotsfield Ave
- 6686 Catoctin Ave
- 6686 Oxendale Ave Unit 3
- 6655 Tranquil Seas Ct
- 7381 Chrome Hill St
- 7552 Wentworth Springs Ct
- 7369 Chrome Hill St
- 6711 Churnet Valley Ave
- 6679 Higger Tor Ave
- 7435 Silurian St
- 6378 Bright Nimbus Ave
- 7526 Gossamer Wind St
- 6526 Netherseal Ave
- 6531 Roundstone Bog Ave
- 6537 Roundstone Bog Ave
- 6525 Roundstone Bog Ave
- 6544 Netherseal Ave
- 6543 Roundstone Bog Ave
- 6533 Netherseal Ave
- 6527 Netherseal Ave
- 6539 Netherseal Ave
- 6550 Netherseal Ave
- 6549 Roundstone Bog Ave
- 7442 Speedwell Cavern St
- 7436 Speedwell Cavern St
- 7448 Speedwell Cavern St Unit 2
- 6556 Netherseal Ave
- 6530 Roundstone Bog Ave
- 6534 Hulme End Ave
- 6536 Roundstone Bog Ave
- 6551 Netherseal Ave
- 6528 Hulme End Ave