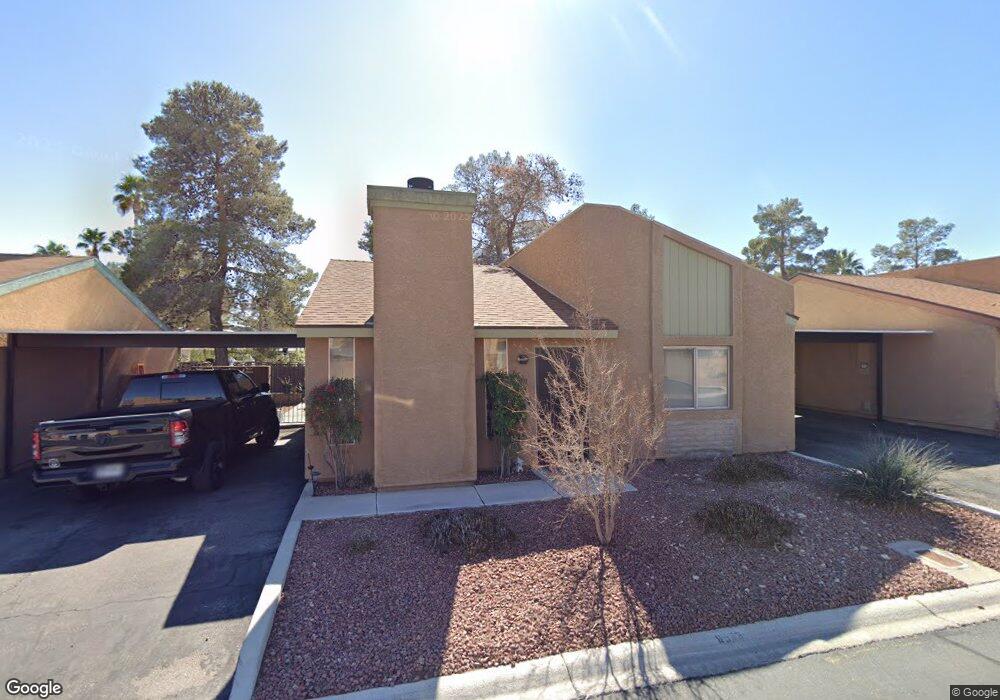
6533 Pinon Pine Way Las Vegas, NV 89108
Michael Way NeighborhoodEstimated Value: $296,000 - $308,000
2
Beds
2
Baths
940
Sq Ft
$323/Sq Ft
Est. Value
About This Home
This home is located at 6533 Pinon Pine Way, Las Vegas, NV 89108 and is currently estimated at $303,305, approximately $322 per square foot. 6533 Pinon Pine Way is a home located in Clark County with nearby schools including Lilly & Wing Fong Elementary School, J. Harold Brinley Middle School, and Cimarron Memorial High School.
Ownership History
Date
Name
Owned For
Owner Type
Purchase Details
Closed on
Apr 3, 2012
Sold by
Stein Charles Francis and Stein Becky Lou
Bought by
Manthey Ronald and Manthey Lu Ann
Current Estimated Value
Purchase Details
Closed on
Jul 12, 2004
Sold by
Ramirez Israel Jacobo and Moraon Vega Angelina
Bought by
Stein Charles Francis and Richardson Becky Lou
Home Financials for this Owner
Home Financials are based on the most recent Mortgage that was taken out on this home.
Original Mortgage
$122,400
Interest Rate
6.27%
Mortgage Type
Stand Alone First
Purchase Details
Closed on
Apr 12, 1999
Sold by
Pisano Dominic R and Pisano Ruth A
Bought by
Ramirez Israel Jacobo and Morson Vega Angelina
Home Financials for this Owner
Home Financials are based on the most recent Mortgage that was taken out on this home.
Original Mortgage
$85,838
Interest Rate
6.94%
Mortgage Type
FHA
Create a Home Valuation Report for This Property
The Home Valuation Report is an in-depth analysis detailing your home's value as well as a comparison with similar homes in the area
Home Values in the Area
Average Home Value in this Area
Purchase History
| Date | Buyer | Sale Price | Title Company |
|---|---|---|---|
| Manthey Ronald | $35,000 | Fidelity National Title Las | |
| Stein Charles Francis | $153,000 | National Title Company | |
| Ramirez Israel Jacobo | $89,500 | Fidelity National Title Agen |
Source: Public Records
Mortgage History
| Date | Status | Borrower | Loan Amount |
|---|---|---|---|
| Previous Owner | Stein Charles Francis | $122,400 | |
| Previous Owner | Ramirez Israel Jacobo | $85,838 |
Source: Public Records
Tax History Compared to Growth
Tax History
| Year | Tax Paid | Tax Assessment Tax Assessment Total Assessment is a certain percentage of the fair market value that is determined by local assessors to be the total taxable value of land and additions on the property. | Land | Improvement |
|---|---|---|---|---|
| 2025 | $826 | $47,946 | $23,100 | $24,846 |
| 2024 | $765 | $47,946 | $23,100 | $24,846 |
| 2023 | $765 | $41,132 | $17,150 | $23,982 |
| 2022 | $709 | $37,549 | $15,400 | $22,149 |
| 2021 | $656 | $35,924 | $14,700 | $21,224 |
| 2020 | $607 | $34,187 | $12,950 | $21,237 |
| 2019 | $569 | $32,333 | $11,200 | $21,133 |
| 2018 | $542 | $28,508 | $8,050 | $20,458 |
| 2017 | $890 | $26,817 | $6,300 | $20,517 |
| 2016 | $509 | $26,867 | $5,950 | $20,917 |
| 2015 | $507 | $21,335 | $3,850 | $17,485 |
| 2014 | $491 | $14,202 | $3,500 | $10,702 |
Source: Public Records
Map
Nearby Homes
- 6557 Sweetzer Way
- 2308 Avery Dr
- 2248 Short Pine Dr
- 2201 James Bilbray Dr
- 6465 Big Pine Way
- 2204 Short Pine Dr
- 2228 Silver Pine Dr Unit 3
- 6577 Goldensun Ct
- 6444 Peartree Rd
- 6437 Peachwood Rd
- 2136 Bavington Dr Unit A
- 2140 Bavington Dr Unit B
- 6544 Gumwood Rd
- 6529 Hartwood Rd
- 2204 Tall Pine Dr
- 2433 Cycad Tree St
- 2124 Willowbury Dr Unit D
- 2132 Chertsey Dr Unit D
- 2132 Chertsey Dr Unit B
- 2121 Chertsey Dr Unit D
- 6529 Pinon Pine Way
- 6537 Pinon Pine Way
- 6525 Pinon Pine Way
- 6525 Pinon Pine Way
- 6525 Pinon Pine Way Unit n/a
- 6541 Pinon Pine Way
- 6521 Raspberry Ridge Ave Unit 103
- 6521 Raspberry Ridge Ave Unit 104
- 6521 Raspberry Ridge Ave Unit 102
- 6521 Raspberry Ridge Ave Unit 101
- 6536 Pinon Pine Way
- 6529 Smokey Pine Way
- 6528 Pinon Pine Way
- 6537 Smokey Pine Way
- 6537 Smokey Pine Way
- 6521 Pinon Pine Way
- 6545 Pinon Pine Way
- 6544 Pinon Pine Way
- 6525 Raspberry Ridge Ave Unit 101
- 6525 Raspberry Ridge Ave Unit 103