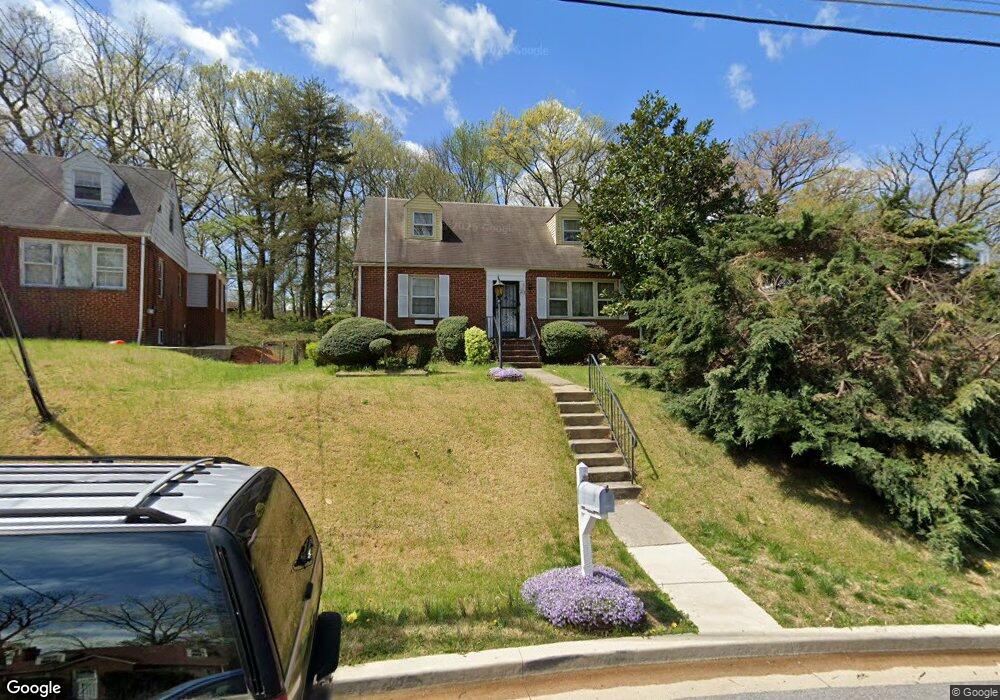
6537 Bock Terrace Oxon Hill, MD 20745
Estimated Value: $383,000 - $420,000
--
Bed
2
Baths
1,326
Sq Ft
$300/Sq Ft
Est. Value
About This Home
This home is located at 6537 Bock Terrace, Oxon Hill, MD 20745 and is currently estimated at $397,843, approximately $300 per square foot. 6537 Bock Terrace is a home located in Prince George's County with nearby schools including Flintstone Elementary School, Oxon Hill Middle School, and Oxon Hill High School.
Ownership History
Date
Name
Owned For
Owner Type
Purchase Details
Closed on
Jan 3, 2007
Sold by
Sewell Sewell W
Bought by
Wade Wanda A
Current Estimated Value
Home Financials for this Owner
Home Financials are based on the most recent Mortgage that was taken out on this home.
Original Mortgage
$438,000
Outstanding Balance
$263,175
Interest Rate
6.4%
Mortgage Type
Reverse Mortgage Home Equity Conversion Mortgage
Estimated Equity
$134,668
Purchase Details
Closed on
Dec 15, 2006
Sold by
Sewell Sewell W
Bought by
Wade Wanda A
Home Financials for this Owner
Home Financials are based on the most recent Mortgage that was taken out on this home.
Original Mortgage
$438,000
Outstanding Balance
$263,175
Interest Rate
6.4%
Mortgage Type
Reverse Mortgage Home Equity Conversion Mortgage
Estimated Equity
$134,668
Purchase Details
Closed on
Feb 5, 1999
Sold by
Lewis Gary A
Bought by
Sewell Wanda A
Purchase Details
Closed on
Sep 22, 1976
Sold by
Stults Phillip D
Bought by
Lewis Gary A
Create a Home Valuation Report for This Property
The Home Valuation Report is an in-depth analysis detailing your home's value as well as a comparison with similar homes in the area
Home Values in the Area
Average Home Value in this Area
Purchase History
| Date | Buyer | Sale Price | Title Company |
|---|---|---|---|
| Wade Wanda A | -- | -- | |
| Wade Wanda A | -- | -- | |
| Sewell Wanda A | $132,000 | -- | |
| Lewis Gary A | $43,100 | -- |
Source: Public Records
Mortgage History
| Date | Status | Borrower | Loan Amount |
|---|---|---|---|
| Open | Wade Wanda A | $438,000 | |
| Closed | Wade Wanda A | $438,000 |
Source: Public Records
Tax History Compared to Growth
Tax History
| Year | Tax Paid | Tax Assessment Tax Assessment Total Assessment is a certain percentage of the fair market value that is determined by local assessors to be the total taxable value of land and additions on the property. | Land | Improvement |
|---|---|---|---|---|
| 2025 | $3,843 | $318,633 | -- | -- |
| 2024 | $3,843 | $298,700 | $86,700 | $212,000 |
| 2023 | $3,658 | $274,233 | $0 | $0 |
| 2022 | $794 | $249,767 | $0 | $0 |
| 2021 | $770 | $225,300 | $75,800 | $149,500 |
| 2020 | $751 | $216,867 | $0 | $0 |
| 2019 | $3,114 | $208,433 | $0 | $0 |
| 2018 | $702 | $200,000 | $75,800 | $124,200 |
| 2017 | $2,927 | $186,833 | $0 | $0 |
| 2016 | -- | $173,667 | $0 | $0 |
| 2015 | $606 | $160,500 | $0 | $0 |
| 2014 | $606 | $160,500 | $0 | $0 |
Source: Public Records
Map
Nearby Homes
- 6900 Stirling St
- 6524 Buckland Ct
- 6348 Stonewain Ct
- 1110 Vinson St
- 7100 Southlawn Dr
- 7009 Shagbark Ct
- 6225 Dimrill Ct
- 6903 Bock Rd
- 2016 Belfast Dr
- 1007 Comanche Dr
- 5926 Shoshone Dr
- 2004 Wolf St
- 2107 High Timber Rd
- 6120 Brandyhall Ct
- 6510 Trowbridge Place
- 1206 Crisfield Dr
- 5605 Fargo Ave
- 5812 Shoshone Dr
- 2105 Calhoun St
- 1805 Jarvis Ave
- 6533 Bock Terrace
- 6541 Bock Terrace
- 6529 Bock Terrace
- 6545 Bock Terrace
- 6525 Bock Terrace
- 6600 Livingston Rd
- 6521 Bock Terrace
- 6602 Livingston Rd
- 6542 Bock Terrace
- 6508 Livingston Rd
- 6604 Livingston Rd
- 6530 Bock Terrace
- 6515 Bock Terrace
- 6549 Bock Terrace
- 6506 Livingston Rd
- 6524 Bock Terrace
- 6516 Bock Terrace
- 6556 Bock Terrace
- 6504 Livingston Rd
- 6608 Livingston Rd