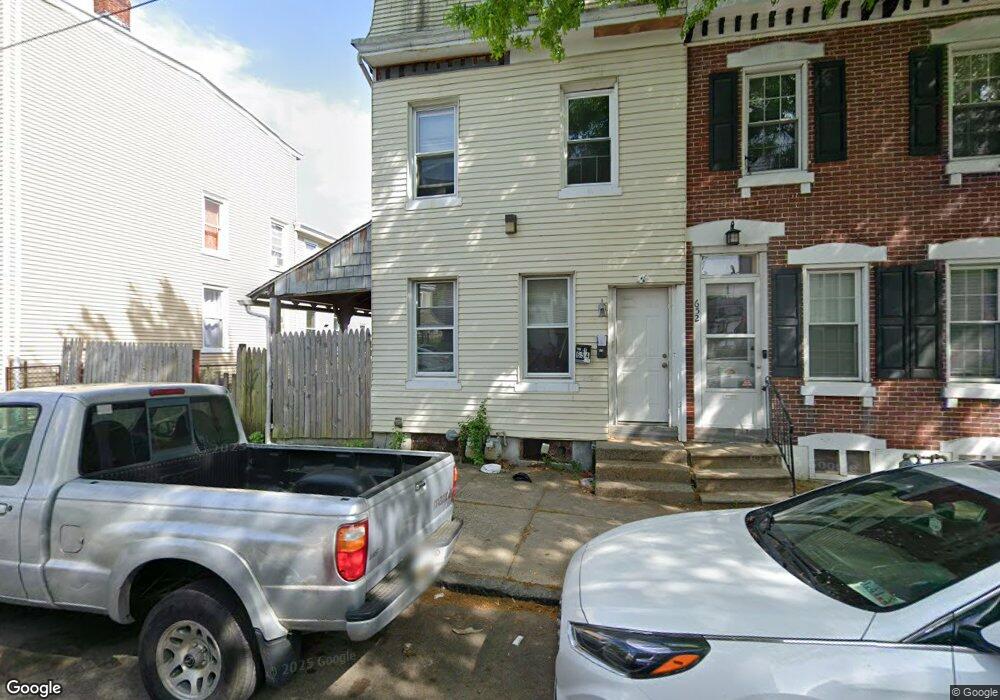
654 Chain St Norristown, PA 19401
Estimated Value: $225,000 - $382,000
3
Beds
2
Baths
2,484
Sq Ft
$120/Sq Ft
Est. Value
About This Home
This home is located at 654 Chain St, Norristown, PA 19401 and is currently estimated at $298,577, approximately $120 per square foot. 654 Chain St is a home located in Montgomery County with nearby schools including Davenport Elementary School, Charles Blockson Middle School, and East Norriton Middle School.
Ownership History
Date
Name
Owned For
Owner Type
Purchase Details
Closed on
Aug 15, 2008
Sold by
Gilrain David E
Bought by
Quigley Francis
Current Estimated Value
Purchase Details
Closed on
Oct 20, 2004
Sold by
Wolfgang David R and Wolfgang Mary
Bought by
Gilrain David E
Home Financials for this Owner
Home Financials are based on the most recent Mortgage that was taken out on this home.
Original Mortgage
$76,500
Interest Rate
5.71%
Purchase Details
Closed on
Jul 21, 2003
Sold by
Wolfgang David R
Bought by
Wolfgang David R and Wolfgang Mary
Create a Home Valuation Report for This Property
The Home Valuation Report is an in-depth analysis detailing your home's value as well as a comparison with similar homes in the area
Home Values in the Area
Average Home Value in this Area
Purchase History
| Date | Buyer | Sale Price | Title Company |
|---|---|---|---|
| Quigley Francis | $60,000 | None Available | |
| Gilrain David E | $85,000 | -- | |
| Wolfgang David R | -- | -- |
Source: Public Records
Mortgage History
| Date | Status | Borrower | Loan Amount |
|---|---|---|---|
| Previous Owner | Gilrain David E | $76,500 |
Source: Public Records
Tax History Compared to Growth
Tax History
| Year | Tax Paid | Tax Assessment Tax Assessment Total Assessment is a certain percentage of the fair market value that is determined by local assessors to be the total taxable value of land and additions on the property. | Land | Improvement |
|---|---|---|---|---|
| 2025 | $3,271 | $53,290 | -- | -- |
| 2024 | $3,271 | $53,290 | -- | -- |
| 2023 | $3,242 | $53,290 | $0 | $0 |
| 2022 | $3,172 | $53,290 | $0 | $0 |
| 2021 | $3,156 | $53,290 | $0 | $0 |
| 2020 | $3,011 | $53,290 | $0 | $0 |
| 2019 | $2,956 | $53,290 | $0 | $0 |
| 2018 | $1,967 | $53,290 | $0 | $0 |
| 2017 | $2,714 | $53,290 | $0 | $0 |
| 2016 | $2,694 | $53,290 | $0 | $0 |
| 2015 | $2,629 | $53,290 | $0 | $0 |
| 2014 | $2,581 | $53,290 | $0 | $0 |
Source: Public Records
Map
Nearby Homes