Estimated Value: $949,000 - $2,259,000
2
Beds
1
Bath
972
Sq Ft
$1,494/Sq Ft
Est. Value
About This Home
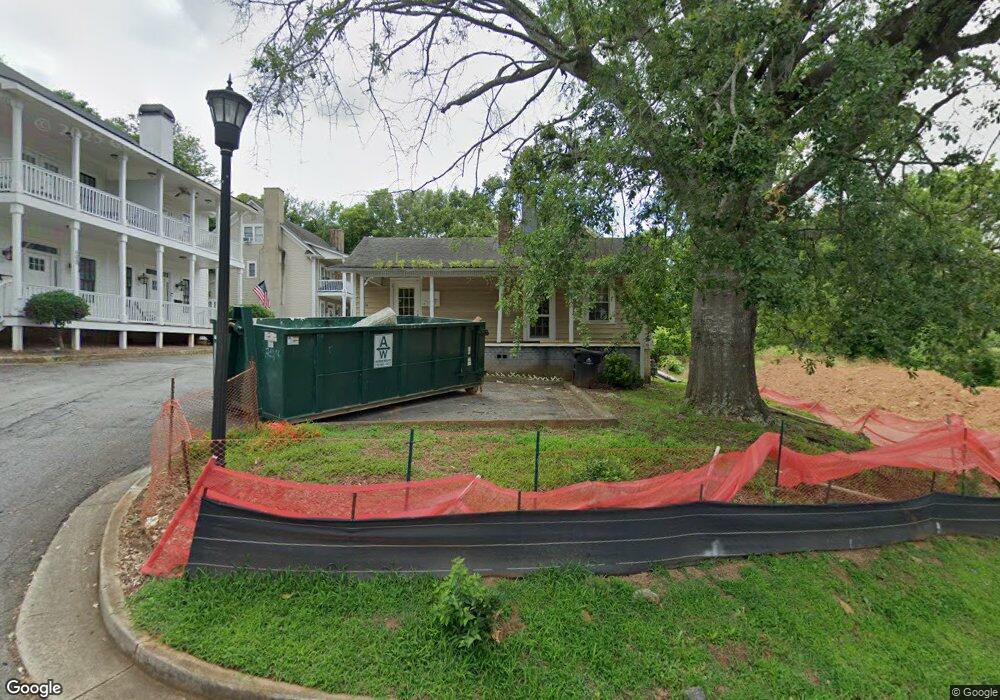
This home is located at 654 Elm St, Roswell, GA 30075 and is currently estimated at $1,452,245, approximately $1,494 per square foot. 654 Elm St is a home located in Fulton County with nearby schools including Roswell North Elementary School, Crabapple Middle School, and Roswell High School.
Ownership History
Date
Name
Owned For
Owner Type
Purchase Details
Closed on
Sep 11, 2023
Sold by
Jones Derek
Bought by
640 Elm Street Llc
Current Estimated Value
Purchase Details
Closed on
Dec 1, 2020
Sold by
Southern Pines Construction Grp
Bought by
Private Lending Grp Llc
Purchase Details
Closed on
Feb 28, 2020
Sold by
Southern Pines Construction Grp Llc
Bought by
Jones Der
Home Financials for this Owner
Home Financials are based on the most recent Mortgage that was taken out on this home.
Original Mortgage
$364,053
Interest Rate
3.5%
Mortgage Type
New Conventional
Purchase Details
Closed on
Oct 20, 2017
Sold by
Constructio Southern Pines
Bought by
Skm Capital Llc
Create a Home Valuation Report for This Property
The Home Valuation Report is an in-depth analysis detailing your home's value as well as a comparison with similar homes in the area
Home Values in the Area
Average Home Value in this Area
Purchase History
| Date | Buyer | Sale Price | Title Company |
|---|---|---|---|
| 640 Elm Street Llc | -- | -- | |
| Private Lending Grp Llc | -- | -- | |
| Elm Street Partners Llc | -- | -- | |
| Jones Der | $383,214 | -- | |
| Skm Capital Llc | $460,000 | -- |
Source: Public Records
Mortgage History
| Date | Status | Borrower | Loan Amount |
|---|---|---|---|
| Previous Owner | Jones Der | $364,053 |
Source: Public Records
Tax History Compared to Growth
Tax History
| Year | Tax Paid | Tax Assessment Tax Assessment Total Assessment is a certain percentage of the fair market value that is determined by local assessors to be the total taxable value of land and additions on the property. | Land | Improvement |
|---|---|---|---|---|
| 2025 | $2,623 | $582,000 | $89,040 | $492,960 |
| 2023 | $15,442 | $547,080 | $75,400 | $471,680 |
| 2022 | $13,499 | $521,920 | $52,560 | $469,360 |
| 2021 | $15,864 | $498,120 | $55,600 | $442,520 |
| 2020 | $14,699 | $448,880 | $51,240 | $397,640 |
| 2019 | $2,436 | $491,600 | $47,720 | $443,880 |
| 2018 | $10,186 | $360,880 | $56,960 | $303,920 |
| 2017 | $7,728 | $264,880 | $35,160 | $229,720 |
| 2016 | $7,730 | $264,880 | $35,160 | $229,720 |
| 2015 | $9,206 | $264,880 | $35,160 | $229,720 |
| 2014 | $8,119 | $264,880 | $35,160 | $229,720 |
Source: Public Records
Map
Nearby Homes
- 69 Maple St
- 53 Maple St
- 49 Sloan St
- 164 Oxbo Rd
- 530 Neel Reid Dr
- 815 Maplewood Dr
- 520 Clover Ct
- 3330 Overland Dr
- 3120 Overland Dr
- 400 Old Tree Trace
- 285 Roswell Farms Dr
- 56 Pine St
- 383 Westside Dr Unit 13
- 383 Westside Dr
- 125 Spring Dr
- 7753 Georgetown Chase Unit 7753
- 104 Bridgecrest Rd
- 410 Canton Walk
- 117 Bridgecrest Rd Unit 24
- Brayton Plan at The Groves at Myrtle