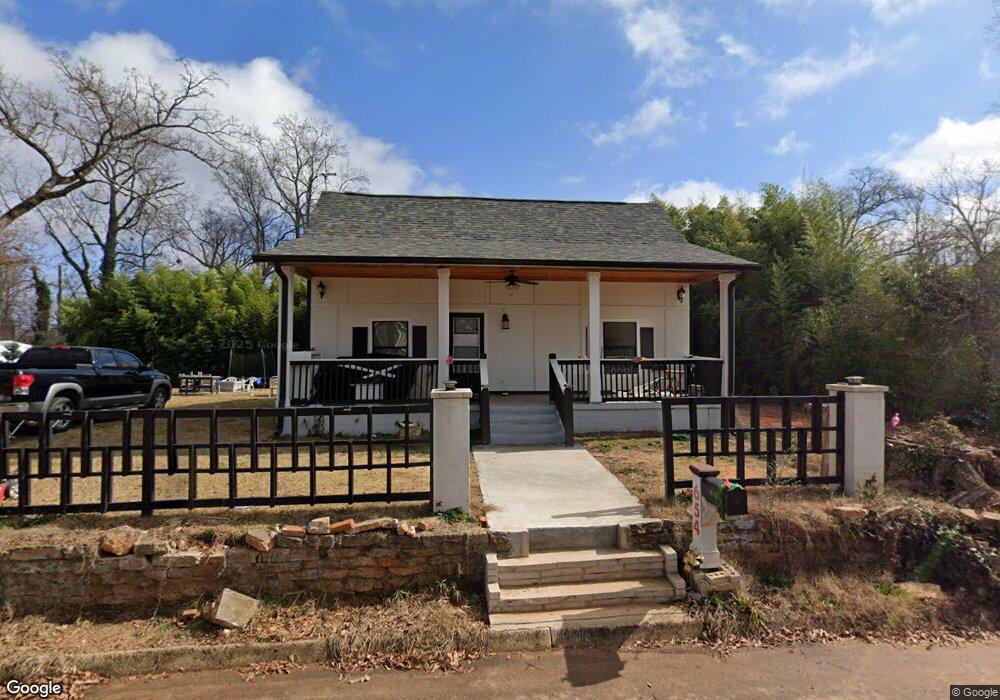
654 Garrett St Griffin, GA 30223
Spalding County NeighborhoodEstimated Value: $97,000 - $124,441
2
Beds
1
Bath
864
Sq Ft
$121/Sq Ft
Est. Value
About This Home
This home is located at 654 Garrett St, Griffin, GA 30223 and is currently estimated at $104,860, approximately $121 per square foot. 654 Garrett St is a home located in Spalding County with nearby schools including Orrs Elementary School, Carver Road Middle School, and Griffin High School.
Ownership History
Date
Name
Owned For
Owner Type
Purchase Details
Closed on
Sep 16, 2020
Sold by
Lee Sheryl
Bought by
Garcia Guadalupe Juan Reyes
Current Estimated Value
Home Financials for this Owner
Home Financials are based on the most recent Mortgage that was taken out on this home.
Original Mortgage
$36,000
Interest Rate
2.9%
Mortgage Type
New Conventional
Purchase Details
Closed on
Jan 30, 2018
Sold by
Davis Sheryl L
Bought by
Davis Sheryl L and Davis Richard E
Purchase Details
Closed on
Jul 17, 2017
Sold by
Stampfli Teresa D
Bought by
Davis Sheryl Lynn
Purchase Details
Closed on
Sep 8, 2016
Sold by
Chamlee Ronald Todd Estate
Bought by
Thompson Sheryl
Purchase Details
Closed on
Sep 1, 2016
Sold by
Sheryl
Bought by
Stampfli Theresa D
Purchase Details
Closed on
May 24, 2001
Sold by
Hill Raymond L
Bought by
Chamlee Ronald T
Purchase Details
Closed on
Jul 12, 1976
Sold by
Waller Louise H
Bought by
Harris Grace S
Purchase Details
Closed on
Jul 16, 1960
Bought by
Waller Louise H
Create a Home Valuation Report for This Property
The Home Valuation Report is an in-depth analysis detailing your home's value as well as a comparison with similar homes in the area
Home Values in the Area
Average Home Value in this Area
Purchase History
| Date | Buyer | Sale Price | Title Company |
|---|---|---|---|
| Garcia Guadalupe Juan Reyes | $56,000 | -- | |
| Davis Sheryl L | -- | -- | |
| Davis Sheryl Lynn | -- | -- | |
| Thompson Sheryl | -- | -- | |
| Stampfli Theresa D | -- | -- | |
| Chamlee Ronald T | $34,500 | -- | |
| Harris Grace S | -- | -- | |
| Waller Louise H | $4,400 | -- |
Source: Public Records
Mortgage History
| Date | Status | Borrower | Loan Amount |
|---|---|---|---|
| Closed | Garcia Guadalupe Juan Reyes | $36,000 |
Source: Public Records
Tax History Compared to Growth
Tax History
| Year | Tax Paid | Tax Assessment Tax Assessment Total Assessment is a certain percentage of the fair market value that is determined by local assessors to be the total taxable value of land and additions on the property. | Land | Improvement |
|---|---|---|---|---|
| 2024 | $999 | $28,475 | $3,840 | $24,635 |
| 2023 | $999 | $27,994 | $3,840 | $24,154 |
| 2022 | $1,011 | $25,288 | $2,880 | $22,408 |
| 2021 | $876 | $21,924 | $2,880 | $19,044 |
| 2020 | $332 | $8,296 | $2,880 | $5,416 |
| 2019 | $338 | $8,296 | $2,880 | $5,416 |
| 2018 | $330 | $7,801 | $2,880 | $4,921 |
| 2017 | $322 | $7,801 | $2,880 | $4,921 |
| 2016 | $328 | $7,801 | $2,880 | $4,921 |
| 2015 | $333 | $7,801 | $2,880 | $4,921 |
| 2014 | $343 | $7,801 | $2,880 | $4,921 |
Source: Public Records
Map
Nearby Homes
- 602 Melrose Ave
- 2 Cedar Ave
- 65 Elm St
- 116 Peachtree St
- 121 Peachtree St
- 1017 Lake Ave
- 1024 Lake Ave
- 202 Cheatham St
- 124 Ohoopee Dr
- 417 N 16th St
- 1102 Thompson St
- 306 Louise Ln Unit A
- 1391 Experiment St Unit 12
- 1391 Experiment St
- 354 N 17th St
- 116 Crystal Brook
- 82 Crystal Brook
- 86 Crystal Brook Unit 3
- 1223 W Broad St
- 1206 Hillwood Ave
- 650 Garrett St
- 1354 Ellis Rd
- 1356 Ellis Rd
- 655 Garrett St
- 649 Moody St
- 651 Garrett St
- 646 Garrett St
- 645 Moody St
- 647 Garrett St Unit 23
- 647 Garrett St
- 1360 Ellis Rd
- 652 Melrose Ave
- 642 Garrett St
- 641 Moody St
- 1345 Herndon St
- 646 Melrose Ave
- 1336 Ellis Rd
- 643 Garrett St
- 638 Garrett St
- 1337 Herndon St