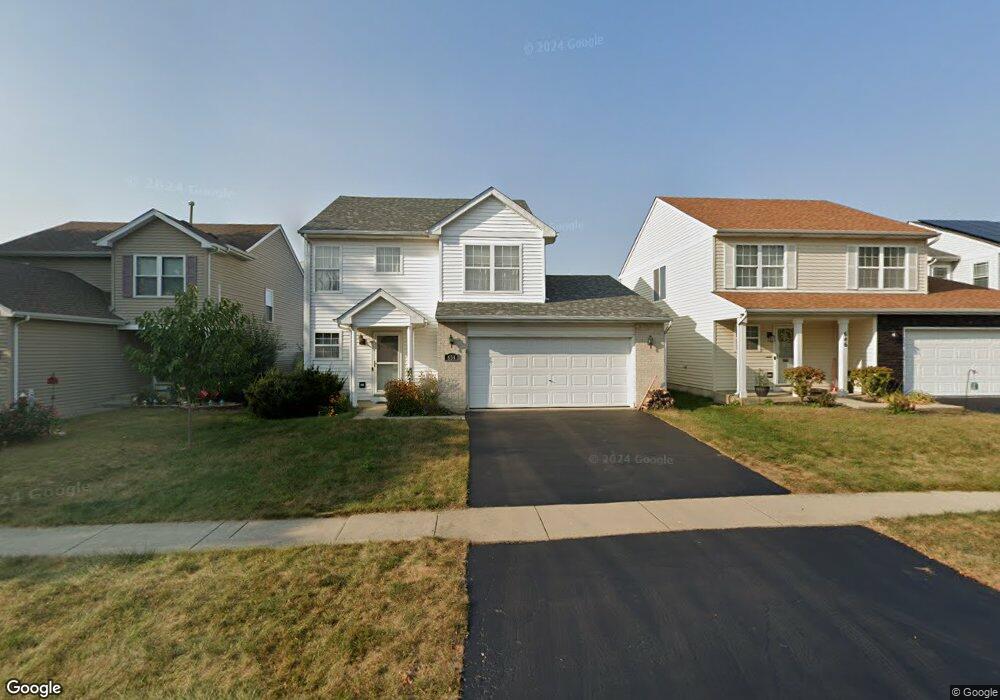
654 Navajo St Round Lake Heights, IL 60073
Estimated Value: $321,366 - $355,000
3
Beds
2
Baths
1,705
Sq Ft
$195/Sq Ft
Est. Value
About This Home
This home is located at 654 Navajo St, Round Lake Heights, IL 60073 and is currently estimated at $332,342, approximately $194 per square foot. 654 Navajo St is a home located in Lake County with nearby schools including Olive C Martin School, Palombi Middle School, and Grant Community High School.
Ownership History
Date
Name
Owned For
Owner Type
Purchase Details
Closed on
Feb 5, 2020
Sold by
Ciesielka Ashley and Corney Ashley
Bought by
Ciesielka Jason
Current Estimated Value
Purchase Details
Closed on
Jun 29, 2006
Sold by
Souranis Nick and Souranis Kimberly
Bought by
Ciesielka Jason and Corney Ashley
Home Financials for this Owner
Home Financials are based on the most recent Mortgage that was taken out on this home.
Original Mortgage
$199,117
Outstanding Balance
$118,732
Interest Rate
6.73%
Mortgage Type
FHA
Estimated Equity
$213,610
Purchase Details
Closed on
Dec 1, 2000
Sold by
Classic Homes Construction Inc
Bought by
Souranis Nick and Souranis Kimberly A
Home Financials for this Owner
Home Financials are based on the most recent Mortgage that was taken out on this home.
Original Mortgage
$151,760
Interest Rate
7.8%
Mortgage Type
FHA
Create a Home Valuation Report for This Property
The Home Valuation Report is an in-depth analysis detailing your home's value as well as a comparison with similar homes in the area
Home Values in the Area
Average Home Value in this Area
Purchase History
| Date | Buyer | Sale Price | Title Company |
|---|---|---|---|
| Ciesielka Jason | -- | None Available | |
| Ciesielka Jason | $206,500 | First American Title Ins Co | |
| Souranis Nick | $154,000 | -- |
Source: Public Records
Mortgage History
| Date | Status | Borrower | Loan Amount |
|---|---|---|---|
| Open | Ciesielka Jason | $199,117 | |
| Previous Owner | Souranis Nick | $151,760 |
Source: Public Records
Tax History Compared to Growth
Tax History
| Year | Tax Paid | Tax Assessment Tax Assessment Total Assessment is a certain percentage of the fair market value that is determined by local assessors to be the total taxable value of land and additions on the property. | Land | Improvement |
|---|---|---|---|---|
| 2024 | $6,101 | $79,906 | $12,508 | $67,398 |
| 2023 | $5,475 | $70,600 | $11,051 | $59,549 |
| 2022 | $5,475 | $60,551 | $10,003 | $50,548 |
| 2021 | $5,210 | $56,248 | $9,292 | $46,956 |
| 2020 | $5,192 | $54,446 | $8,994 | $45,452 |
| 2019 | $5,317 | $52,327 | $8,644 | $43,683 |
| 2018 | $4,689 | $46,513 | $10,620 | $35,893 |
| 2017 | $4,653 | $45,273 | $10,337 | $34,936 |
| 2016 | $4,779 | $43,439 | $9,918 | $33,521 |
| 2015 | $4,580 | $40,571 | $9,263 | $31,308 |
| 2014 | $4,172 | $39,236 | $7,768 | $31,468 |
| 2012 | $4,391 | $39,425 | $7,805 | $31,620 |
Source: Public Records
Map
Nearby Homes
- 686 Chippewa Cir
- 411 Red Cedar Rd Unit I
- 2292 Iroquois Ln
- 330 Greenview Ln
- 862 Chesapeake Trail
- 535 Normandie Ln
- 527 Normandie Ln
- 2033 Westview Ln Unit 5
- 2146 Prairie Trail
- 2011 Westview Ln
- 1993 Westview Ln
- 806 Amber Ln
- 512 Meadow Hill Ln
- 81 W Dahlia Ln
- 908 Amber Ln
- 446 Meadow Green Ln Unit 8
- 24570 W Blackcherry Ln
- 1724 Lotus Dr
- 908 Flintwood Ct
- 1998 N Karen Ln
- 646 Navajo St
- 660 Navajo St
- 640 Navajo St
- 668 Navajo St
- 632 Navajo St
- 672 Navajo St
- 655 Navajo St
- 647 Navajo St
- 661 Navajo St
- 680 Navajo St
- 639 Navajo St
- 667 Navajo St
- 626 Navajo St
- 635 Navajo St
- 673 Navajo St Unit 2
- 686 Navajo St
- 681 Navajo St
- 2454 Ojibwa Trail
- 2477 Ojibwa Trail Unit 3
- 692 Navajo St