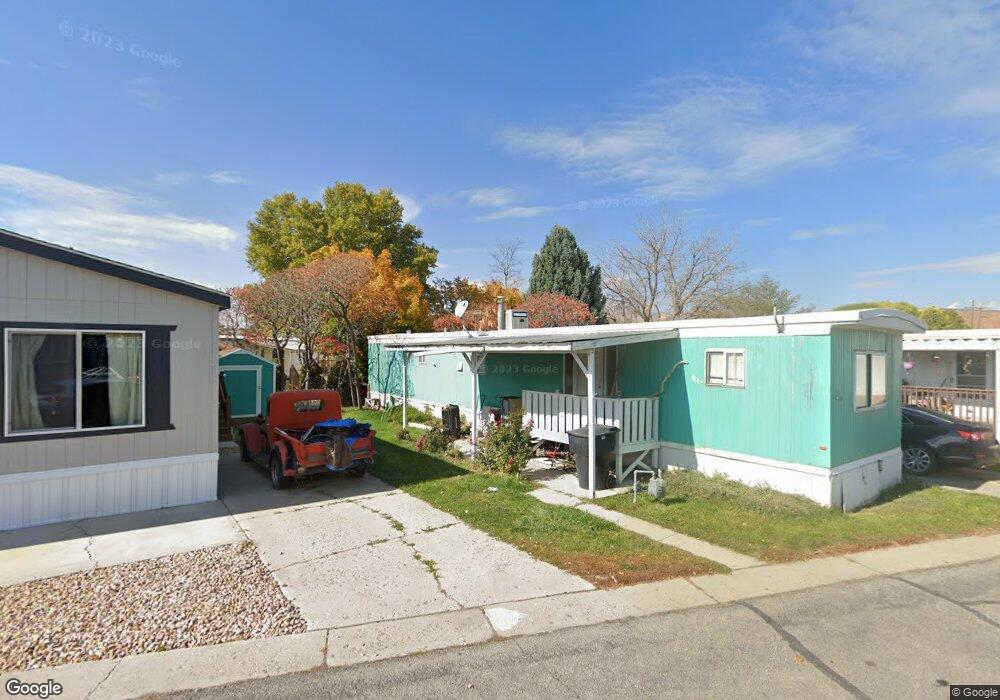
654 S 800 W Payson, UT 84651
Estimated Value: $953,585
2
Beds
1
Bath
728
Sq Ft
$1,310/Sq Ft
Est. Value
About This Home
This home is located at 654 S 800 W, Payson, UT 84651 and is currently priced at $953,585, approximately $1,309 per square foot. 654 S 800 W is a home located in Utah County with nearby schools including Wilson Elementary School, Mt. Nebo Junior High School, and Mt. Nebo Middle.
Ownership History
Date
Name
Owned For
Owner Type
Purchase Details
Closed on
Dec 8, 2021
Sold by
Utpa Orchard Mhp Llc
Bought by
Orchard Hills Community Llc
Current Estimated Value
Purchase Details
Closed on
Feb 24, 2021
Sold by
Lamplighter Tc Mhp Llc
Bought by
Utpa Orchard Mhp Llc
Home Financials for this Owner
Home Financials are based on the most recent Mortgage that was taken out on this home.
Original Mortgage
$2,474,000
Interest Rate
2.7%
Mortgage Type
Commercial
Purchase Details
Closed on
Feb 25, 2020
Sold by
Shuler Sharon and Joyce N Provstggard Trust
Bought by
Provstgaard Properties Llc
Create a Home Valuation Report for This Property
The Home Valuation Report is an in-depth analysis detailing your home's value as well as a comparison with similar homes in the area
Home Values in the Area
Average Home Value in this Area
Purchase History
| Date | Buyer | Sale Price | Title Company |
|---|---|---|---|
| Orchard Hills Community Llc | -- | First American Title | |
| Utpa Orchard Mhp Llc | -- | Stewart Title Guaranty | |
| Provstgaard Properties Llc | -- | Stewart Title Ins Agcy Of Ut |
Source: Public Records
Mortgage History
| Date | Status | Borrower | Loan Amount |
|---|---|---|---|
| Previous Owner | Utpa Orchard Mhp Llc | $2,474,000 |
Source: Public Records
Tax History Compared to Growth
Map
Nearby Homes