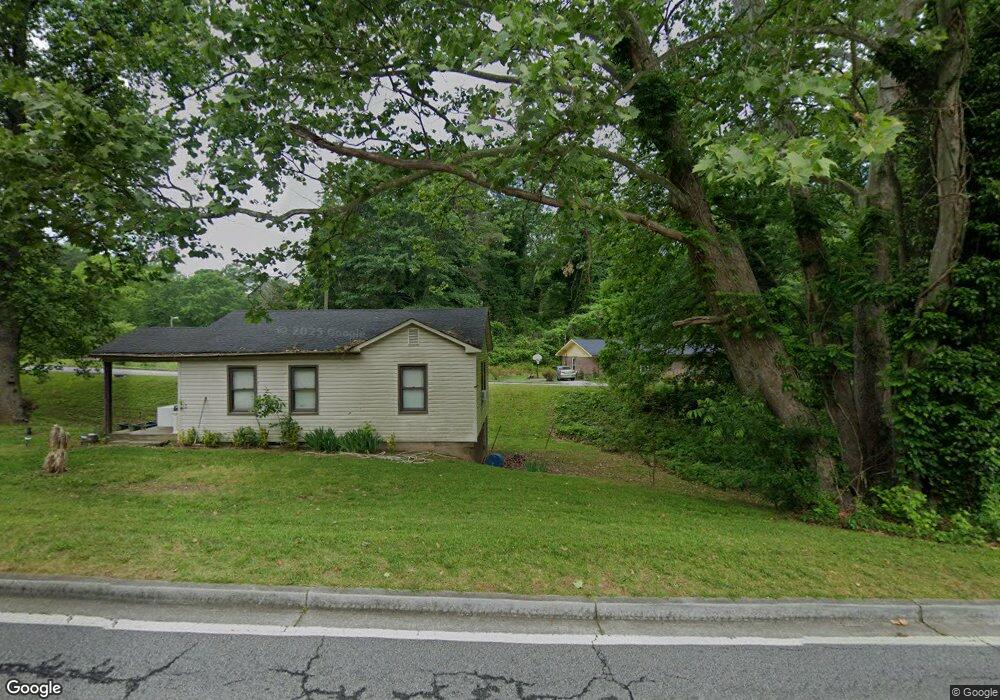
654 S Pond St Toccoa, GA 30577
Estimated Value: $123,000 - $178,000
2
Beds
1
Bath
840
Sq Ft
$183/Sq Ft
Est. Value
About This Home
This home is located at 654 S Pond St, Toccoa, GA 30577 and is currently estimated at $153,777, approximately $183 per square foot. 654 S Pond St is a home located in Stephens County with nearby schools including Stephens County High School.
Ownership History
Date
Name
Owned For
Owner Type
Purchase Details
Closed on
Feb 27, 2024
Sold by
North East Ga Home Solutions Llc
Bought by
German Susie and Solis Adrian M
Current Estimated Value
Home Financials for this Owner
Home Financials are based on the most recent Mortgage that was taken out on this home.
Original Mortgage
$5,600
Outstanding Balance
$5,490
Interest Rate
6.63%
Mortgage Type
New Conventional
Estimated Equity
$148,287
Purchase Details
Closed on
Sep 12, 2023
Sold by
Cochran Robert
Bought by
North East Ga Home Solutions Llc
Home Financials for this Owner
Home Financials are based on the most recent Mortgage that was taken out on this home.
Original Mortgage
$92,400
Interest Rate
7.09%
Mortgage Type
New Conventional
Purchase Details
Closed on
Oct 20, 2015
Sold by
W J Rothell & Co Inc
Bought by
Chaves Donnie and Cochran Robert
Purchase Details
Closed on
Jun 30, 2008
Sold by
Not Provided
Bought by
Gibby Elgan and Gibby Reba P
Create a Home Valuation Report for This Property
The Home Valuation Report is an in-depth analysis detailing your home's value as well as a comparison with similar homes in the area
Purchase History
| Date | Buyer | Sale Price | Title Company |
|---|---|---|---|
| German Susie | $160,000 | -- | |
| North East Ga Home Solutions Llc | $50,000 | -- | |
| Chaves Donnie | $29,000 | -- | |
| Gibby Elgan | -- | -- | |
| Free Deborah E | -- | -- |
Source: Public Records
Mortgage History
| Date | Status | Borrower | Loan Amount |
|---|---|---|---|
| Open | German Susie | $5,600 | |
| Open | German Susie | $157,102 | |
| Previous Owner | North East Ga Home Solutions Llc | $92,400 |
Source: Public Records
Tax History
| Year | Tax Paid | Tax Assessment Tax Assessment Total Assessment is a certain percentage of the fair market value that is determined by local assessors to be the total taxable value of land and additions on the property. | Land | Improvement |
|---|---|---|---|---|
| 2025 | $1,849 | $52,993 | $1,104 | $51,889 |
| 2024 | $1,030 | $28,881 | $1,104 | $27,777 |
| 2023 | $174 | $4,910 | $1,104 | $3,806 |
| 2022 | $138 | $4,621 | $1,104 | $3,517 |
| 2021 | $123 | $3,939 | $1,104 | $2,835 |
| 2020 | $136 | $4,305 | $1,104 | $3,201 |
| 2019 | $137 | $4,305 | $1,104 | $3,201 |
| 2018 | $138 | $4,338 | $1,104 | $3,234 |
| 2017 | $140 | $4,338 | $1,104 | $3,234 |
| 2016 | $76 | $2,393 | $1,104 | $1,289 |
| 2015 | $172 | $5,184 | $1,104 | $4,080 |
| 2014 | $194 | $5,744 | $1,104 | $4,640 |
| 2013 | -- | $5,744 | $1,104 | $4,640 |
Source: Public Records
Map
Nearby Homes
Your Personal Tour Guide
Ask me questions while you tour the home.