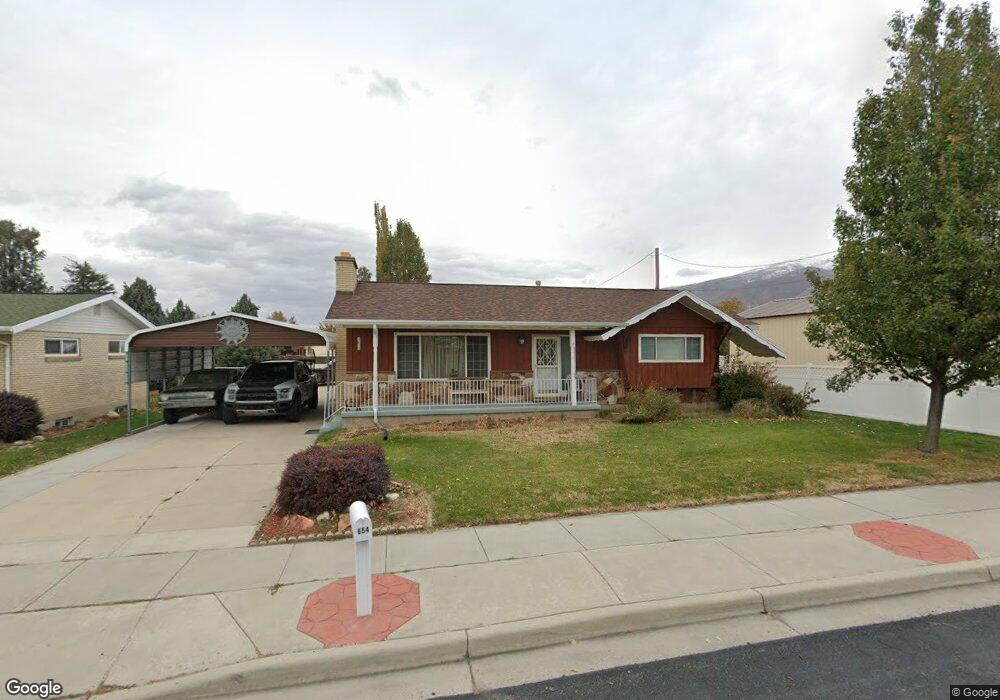
654 W 1000 N West Bountiful, UT 84087
Estimated Value: $523,000 - $551,143
4
Beds
2
Baths
2,408
Sq Ft
$221/Sq Ft
Est. Value
About This Home
This home is located at 654 W 1000 N, West Bountiful, UT 84087 and is currently estimated at $531,536, approximately $220 per square foot. 654 W 1000 N is a home located in Davis County with nearby schools including West Bountiful Elementary School, Bountiful Junior High School, and Viewmont High School.
Ownership History
Date
Name
Owned For
Owner Type
Purchase Details
Closed on
Oct 21, 2011
Sold by
Thompson Terry H and Thompson Pat
Bought by
Vance David
Current Estimated Value
Home Financials for this Owner
Home Financials are based on the most recent Mortgage that was taken out on this home.
Original Mortgage
$140,000
Outstanding Balance
$95,255
Interest Rate
4.05%
Mortgage Type
Future Advance Clause Open End Mortgage
Estimated Equity
$436,281
Purchase Details
Closed on
Mar 31, 2010
Sold by
Thompson Terry H and Thompson Scott H
Bought by
Thompson Terry H and Thompson Pat
Purchase Details
Closed on
Mar 30, 2010
Sold by
Thompson Terry H and Thompson Scott H
Bought by
Thompson Terry H and Thompson Pat
Purchase Details
Closed on
May 19, 1997
Sold by
Thompson Gerald and Thompson Evelyn H
Bought by
Thompson Gerald and Thompson Evelyn H
Create a Home Valuation Report for This Property
The Home Valuation Report is an in-depth analysis detailing your home's value as well as a comparison with similar homes in the area
Home Values in the Area
Average Home Value in this Area
Purchase History
| Date | Buyer | Sale Price | Title Company |
|---|---|---|---|
| Vance David | -- | Aspen Title Insuranc | |
| Thompson Terry H | -- | None Available | |
| Thompson Terry H | -- | None Available | |
| Thompson Gerald | -- | -- |
Source: Public Records
Mortgage History
| Date | Status | Borrower | Loan Amount |
|---|---|---|---|
| Open | Vance David | $140,000 |
Source: Public Records
Tax History Compared to Growth
Tax History
| Year | Tax Paid | Tax Assessment Tax Assessment Total Assessment is a certain percentage of the fair market value that is determined by local assessors to be the total taxable value of land and additions on the property. | Land | Improvement |
|---|---|---|---|---|
| 2025 | $3,320 | $281,050 | $141,749 | $139,301 |
| 2024 | $3,123 | $269,500 | $116,614 | $152,886 |
| 2023 | $3,014 | $476,000 | $220,250 | $255,750 |
| 2022 | $3,101 | $275,000 | $105,926 | $169,074 |
| 2021 | $2,843 | $386,000 | $143,418 | $242,582 |
| 2020 | $2,373 | $315,000 | $132,660 | $182,340 |
| 2019 | $2,382 | $314,000 | $133,526 | $180,474 |
| 2018 | $2,164 | $280,000 | $133,216 | $146,784 |
| 2016 | $1,955 | $137,775 | $35,390 | $102,385 |
| 2015 | $1,842 | $122,320 | $35,390 | $86,930 |
| 2014 | $1,747 | $118,223 | $35,390 | $82,833 |
| 2013 | -- | $110,761 | $33,197 | $77,564 |
Source: Public Records
Map
Nearby Homes
- 790 N 500 W
- 366 W 1000 N
- 825 W 1320 N
- 637 W 1600 N
- Lincoln Farmhouse Plan at Belmont Farms
- Belmont Traditional Plan at Belmont Farms
- Hampton Traditional Plan at Belmont Farms
- 340 N 500 W Unit 204
- 1503 N 300 W
- 235 W 1400 N
- 399 W 400 N Unit 47
- 1194 N 200 W
- 184 Park Shadows Cir
- 553 N 200 W
- 767 W 220 N
- 1260 N 200 W
- 499 N 200 W Unit 30
- 499 N 200 W Unit 19
- 1410 N 200 W
- 810 Park Shadows Cir