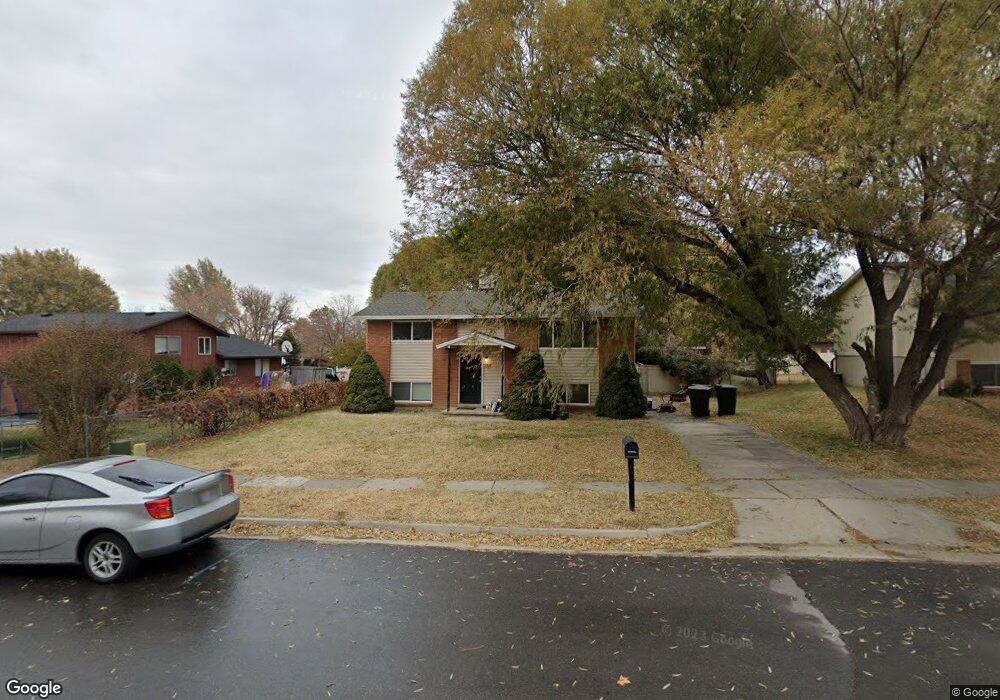
654 W 1635 N Clearfield, UT 84015
Estimated Value: $393,000 - $431,000
5
Beds
2
Baths
1,764
Sq Ft
$235/Sq Ft
Est. Value
About This Home
This home is located at 654 W 1635 N, Clearfield, UT 84015 and is currently estimated at $415,169, approximately $235 per square foot. 654 W 1635 N is a home located in Davis County with nearby schools including Sunset School, Sunset Junior High School, and Clearfield High School.
Ownership History
Date
Name
Owned For
Owner Type
Purchase Details
Closed on
Jul 7, 2021
Sold by
Vialpando Jordyn
Bought by
Vialpando Jordyn and Vialpando Averia
Current Estimated Value
Purchase Details
Closed on
Dec 18, 2019
Sold by
Thomas Lori Lovell
Bought by
Vialpando Jordyn
Home Financials for this Owner
Home Financials are based on the most recent Mortgage that was taken out on this home.
Original Mortgage
$235,653
Outstanding Balance
$207,762
Interest Rate
3.6%
Mortgage Type
FHA
Estimated Equity
$207,407
Purchase Details
Closed on
Feb 26, 2004
Sold by
Thomas Wayne C
Bought by
Thomas Wayne C
Create a Home Valuation Report for This Property
The Home Valuation Report is an in-depth analysis detailing your home's value as well as a comparison with similar homes in the area
Home Values in the Area
Average Home Value in this Area
Purchase History
| Date | Buyer | Sale Price | Title Company |
|---|---|---|---|
| Vialpando Jordyn | -- | None Available | |
| Vialpando Jordyn | -- | Old Republic Natl Title | |
| Thomas Wayne C | -- | -- |
Source: Public Records
Mortgage History
| Date | Status | Borrower | Loan Amount |
|---|---|---|---|
| Open | Vialpando Jordyn | $235,653 |
Source: Public Records
Tax History Compared to Growth
Tax History
| Year | Tax Paid | Tax Assessment Tax Assessment Total Assessment is a certain percentage of the fair market value that is determined by local assessors to be the total taxable value of land and additions on the property. | Land | Improvement |
|---|---|---|---|---|
| 2025 | $2,105 | $202,400 | $87,890 | $114,510 |
| 2024 | $2,060 | $199,101 | $96,861 | $102,240 |
| 2023 | $1,879 | $336,000 | $109,763 | $226,237 |
| 2022 | $1,996 | $197,450 | $67,682 | $129,768 |
| 2021 | $1,935 | $284,000 | $83,818 | $200,182 |
| 2020 | $1,666 | $242,000 | $70,741 | $171,259 |
| 2019 | $687 | $208,000 | $83,558 | $124,442 |
| 2018 | $0 | $182,000 | $70,693 | $111,307 |
| 2016 | $1,135 | $81,675 | $27,427 | $54,248 |
| 2015 | $1,063 | $72,765 | $27,427 | $45,338 |
| 2014 | $996 | $69,245 | $27,427 | $41,818 |
| 2013 | $1,041 | $71,338 | $25,230 | $46,108 |
Source: Public Records
Map
Nearby Homes