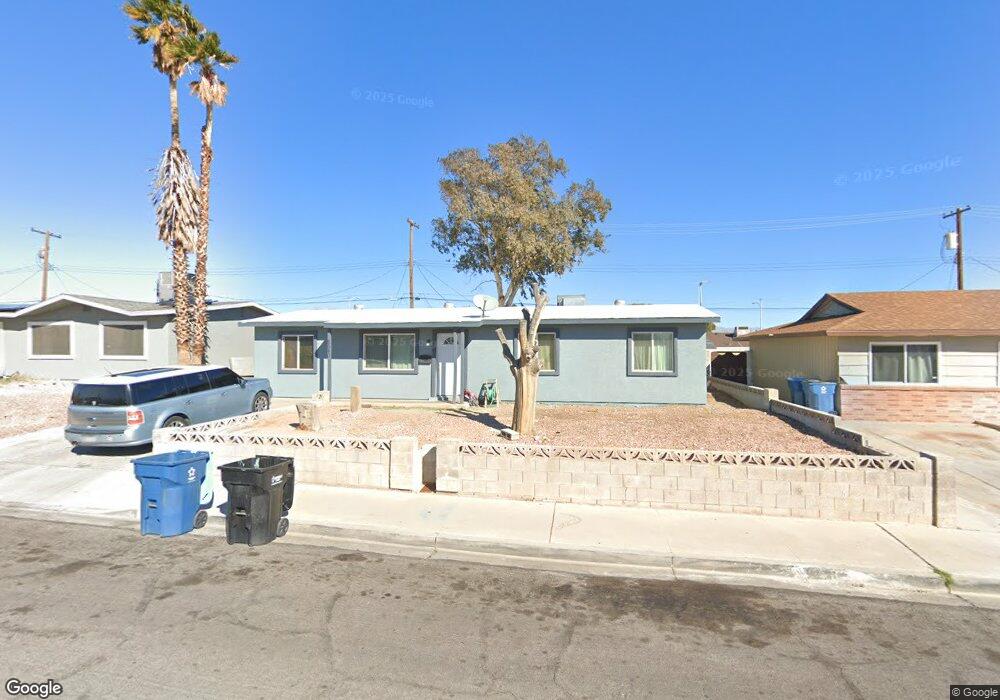
6540 Bourbon Way Las Vegas, NV 89107
Charleston Preservation NeighborhoodEstimated Value: $330,000 - $381,000
3
Beds
1
Bath
1,274
Sq Ft
$278/Sq Ft
Est. Value
About This Home
This home is located at 6540 Bourbon Way, Las Vegas, NV 89107 and is currently estimated at $354,326, approximately $278 per square foot. 6540 Bourbon Way is a home located in Clark County with nearby schools including Rose Warren Elementary School, Frank F Garside Junior High School, and Bonanza High School.
Ownership History
Date
Name
Owned For
Owner Type
Purchase Details
Closed on
Jul 22, 2020
Sold by
Cheung Jian Min
Bought by
Cheung Jian Min and Jian Cheung Trust
Current Estimated Value
Purchase Details
Closed on
Jan 24, 2012
Sold by
U S Bank National Association
Bought by
Zhang Baogi and Cheung Jian Min
Purchase Details
Closed on
Apr 15, 2011
Sold by
Randles Deann and Randles James
Bought by
Bank Of America National Association
Purchase Details
Closed on
Aug 7, 2003
Sold by
Dupuis Investment Services Ltd
Bought by
Randles James and Randles Deann
Home Financials for this Owner
Home Financials are based on the most recent Mortgage that was taken out on this home.
Original Mortgage
$99,808
Interest Rate
8.5%
Mortgage Type
Unknown
Purchase Details
Closed on
May 27, 2003
Sold by
Watts Johnson N
Bought by
Dupuis Investment Services Ltd
Create a Home Valuation Report for This Property
The Home Valuation Report is an in-depth analysis detailing your home's value as well as a comparison with similar homes in the area
Home Values in the Area
Average Home Value in this Area
Purchase History
| Date | Buyer | Sale Price | Title Company |
|---|---|---|---|
| Cheung Jian Min | -- | None Available | |
| Zhang Baogi | $41,000 | Ticor Title Las Vegas | |
| Bank Of America National Association | $40,210 | Accommodation | |
| Randles James | $124,760 | Fidelity National Title | |
| Dupuis Investment Services Ltd | $90,200 | Fidelity National Title |
Source: Public Records
Mortgage History
| Date | Status | Borrower | Loan Amount |
|---|---|---|---|
| Previous Owner | Randles James | $99,808 | |
| Closed | Randles James | $24,952 |
Source: Public Records
Tax History Compared to Growth
Tax History
| Year | Tax Paid | Tax Assessment Tax Assessment Total Assessment is a certain percentage of the fair market value that is determined by local assessors to be the total taxable value of land and additions on the property. | Land | Improvement |
|---|---|---|---|---|
| 2025 | $928 | $47,270 | $30,800 | $16,470 |
| 2024 | $860 | $47,270 | $30,800 | $16,470 |
| 2023 | $860 | $45,266 | $30,450 | $14,816 |
| 2022 | $796 | $38,472 | $25,200 | $13,272 |
| 2021 | $738 | $35,797 | $23,450 | $12,347 |
| 2020 | $682 | $31,616 | $19,600 | $12,016 |
| 2019 | $639 | $29,095 | $17,500 | $11,595 |
| 2018 | $610 | $25,540 | $14,700 | $10,840 |
| 2017 | $811 | $24,746 | $14,000 | $10,746 |
| 2016 | $572 | $20,518 | $10,150 | $10,368 |
| 2015 | $570 | $18,363 | $7,700 | $10,663 |
| 2014 | $552 | $16,338 | $5,250 | $11,088 |
Source: Public Records
Map
Nearby Homes
- 6508 Bourbon Way
- 6612 Burgundy Way
- 6449 Alta Dr
- 421 Courtney Ln
- 416 Lindy Dr
- 404 Vassar Ln
- 6457 Celeste Ave
- 6444 Bannock Way
- 408 Greenfield Ln
- 6409 Burgundy Way
- 6416 Alta Dr
- 6412 Bristol Way
- 6420 Evergreen Ave
- 6701 Theus Cir
- 6432 Bannock Way
- 6709 Theus Cir
- 325 Greenfield Ln
- 6741 Chehalis Cir
- 321 Bent Creek Dr
- 6628 Celeste Ave
- 6536 Bourbon Way
- 6544 Bourbon Way
- 6541 Brandywine Way
- 6537 Brandywine Way
- 6545 Brandywine Way
- 6532 Bourbon Way Unit 27A
- 6548 Bourbon Way
- 6541 Bourbon Way
- 6533 Brandywine Way
- 6549 Brandywine Way
- 6537 Bourbon Way
- 6545 Bourbon Way
- 6552 Bourbon Way
- 6528 Bourbon Way
- 6533 Bourbon Way
- 6549 Bourbon Way
- 6553 Brandywine Way
- 6529 Brandywine Way
- 6553 Bourbon Way
- 6556 Bourbon Way