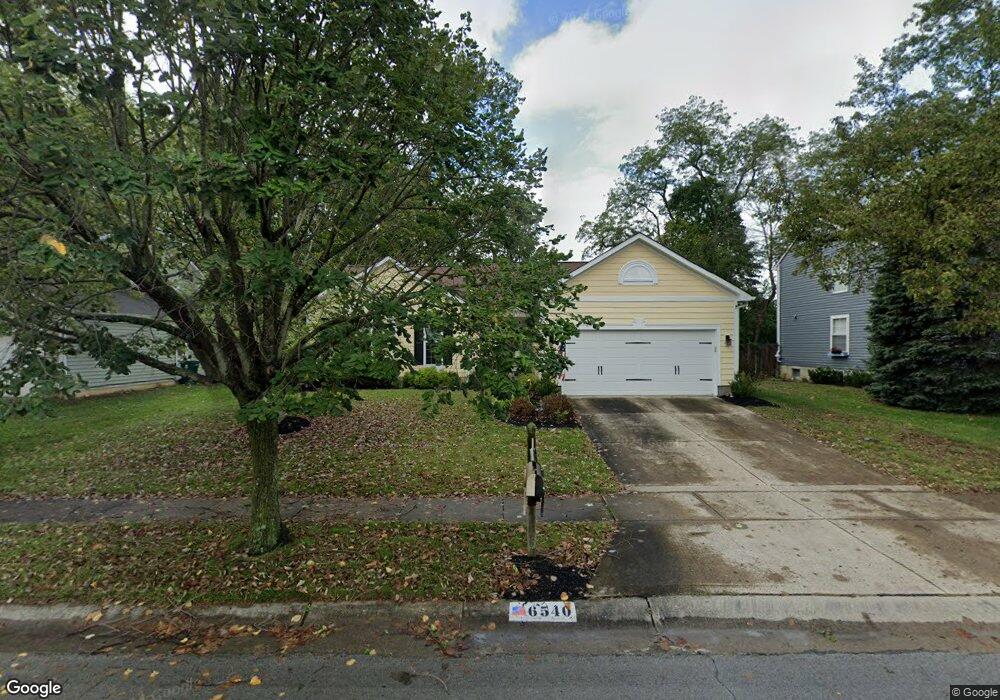
6540 Spindlewick Ln Cincinnati, OH 45230
Mount Washington NeighborhoodEstimated Value: $295,000 - $355,000
About This Home
This home is located at 6540 Spindlewick Ln, Cincinnati, OH 45230 and is currently estimated at $321,009, approximately $206 per square foot. 6540 Spindlewick Ln is a home located in Hamilton County with nearby schools including Mt. Washington Elementary School, Clark Montessori High School, and Shroder High School.
Ownership History
We collect this data history from publicly available records. To have your information removed, we recommend requesting removal directly through your county’s website.
Purchase Details
Home Financials for this Owner
Home Financials are based on the most recent Mortgage that was taken out on this home.Purchase Details
Purchase Details
Purchase Details
Purchase Details
Home Values in the Area
Average Home Value in this Area
Purchase History
We collect this data history from publicly available records. To have your information removed, we recommend requesting removal directly through your county’s website.
| Date | Buyer | Sale Price | Title Company |
|---|---|---|---|
| -- | -- | ||
| $167,800 | -- | ||
| $150,000 | -- | ||
| -- | -- | ||
| -- | -- |
Mortgage History
We collect this data history from publicly available records. To have your information removed, we recommend requesting removal directly through your county’s website.
| Date | Status | Borrower | Loan Amount |
|---|---|---|---|
| Open | $170,800 |
Tax History
We collect this data history from publicly available records. To have your information removed, we recommend requesting removal directly through your county’s website.
| Year | Tax Paid | Tax Assessment Tax Assessment Total Assessment is a certain percentage of the fair market value that is determined by local assessors to be the total taxable value of land and additions on the property. | Land | Improvement |
|---|---|---|---|---|
| 2025 | $5,551 | $89,975 | $16,538 | $73,437 |
| 2023 | $5,504 | $89,975 | $16,538 | $73,437 |
| 2022 | $4,666 | $68,383 | $14,014 | $54,369 |
| 2021 | $4,488 | $68,383 | $14,014 | $54,369 |
| 2020 | $4,619 | $68,383 | $14,014 | $54,369 |
| 2019 | $4,404 | $59,630 | $12,740 | $46,890 |
| 2018 | $4,410 | $59,630 | $12,740 | $46,890 |
| 2017 | $4,190 | $59,630 | $12,740 | $46,890 |
| 2016 | $4,317 | $60,585 | $12,740 | $47,845 |
| 2015 | $3,892 | $60,585 | $12,740 | $47,845 |
| 2014 | $3,920 | $60,585 | $12,740 | $47,845 |
| 2013 | $3,988 | $60,585 | $12,740 | $47,845 |
Map
- 6480 Honeysuckle Dr
- 6570 Knottypine Dr
- 6606 Knottypine Dr
- 1810 Wilaray Terrace
- 1893 Lindsey Ln
- 1944 Rockland Ave
- 1679 Brachman Ave
- 2244 Salvador St
- 1944 Lehigh Ave
- 1741 Mears Ave
- 6505 Silverfox Dr
- 1647 Dell Terrace
- 7034 Bridges Rd
- 2450 Doeview Ct
- 6148 Cambridge Ave
- 6954 Bridges Rd
- 6955 Presidio Ct
- 1735 Sutton Ave
- 6026 Colter Ave
- 6101 Wayside Ct
- 6544 Spindlewick Ln
- 6536 Spindlewick Ln
- 6548 Spindlewick Ln
- 6532 Spindlewick Ln
- 6539 Spindlewick Ln
- 6535 Spindlewick Ln
- 6545 Spindlewick Ln
- 6529 Spindlewick Ln
- 6552 Spindlewick Ln
- 6526 Spindlewick Ln
- 6549 Spindlewick Ln
- 6523 Spindlewick Ln
- 6556 Spindlewick Ln
- 6522 Spindlewick Ln
- 6555 Spindlewick Ln
- 2087 Trailwood Dr
- 2091 Trailwood Dr
- 2083 Trailwood Dr
- 2095 Trailwood Dr
- 6505 Spindlewick Ln
Ask me questions while you tour the home.