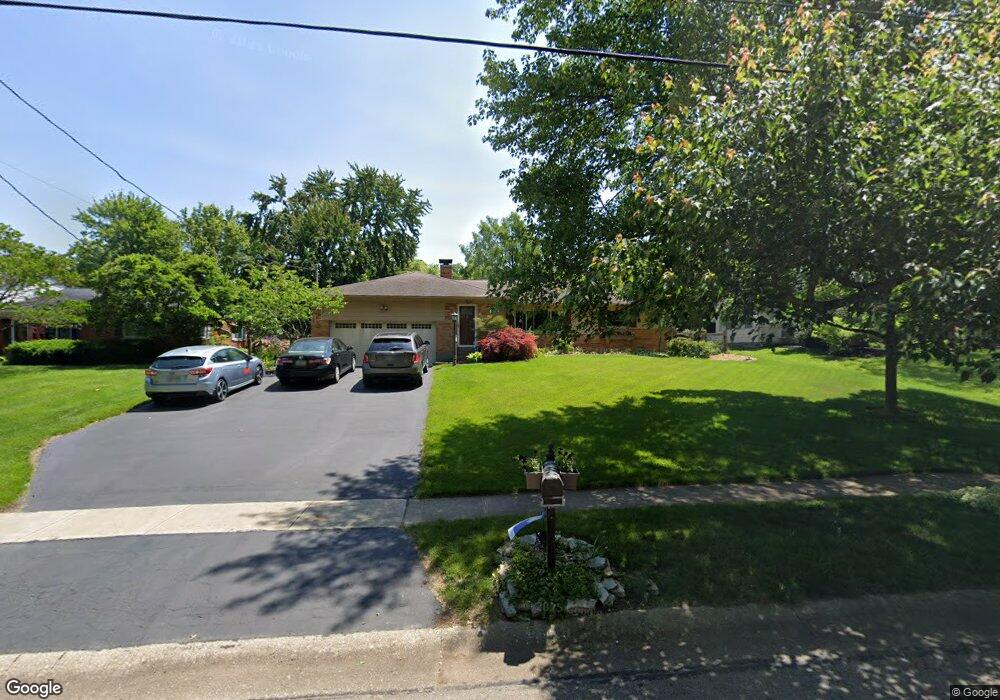
6541 Apache Cir Cincinnati, OH 45243
Estimated Value: $437,000 - $547,000
3
Beds
3
Baths
1,502
Sq Ft
$324/Sq Ft
Est. Value
About This Home
This home is located at 6541 Apache Cir, Cincinnati, OH 45243 and is currently estimated at $486,405, approximately $323 per square foot. 6541 Apache Cir is a home located in Hamilton County with nearby schools including Madeira Elementary School, Madeira Middle School, and Madeira High School.
Ownership History
Date
Name
Owned For
Owner Type
Purchase Details
Closed on
Jan 22, 2003
Sold by
Gumm Raymond and Gumm Edna
Bought by
Quante Gregory P and Quante Mary J
Current Estimated Value
Home Financials for this Owner
Home Financials are based on the most recent Mortgage that was taken out on this home.
Original Mortgage
$175,000
Interest Rate
5.96%
Mortgage Type
Seller Take Back
Purchase Details
Closed on
Dec 13, 2002
Sold by
Cipollone Bonnie L and Cipollone Pasquale J
Bought by
Gumm Raymond and Gumm Edna
Home Financials for this Owner
Home Financials are based on the most recent Mortgage that was taken out on this home.
Original Mortgage
$175,000
Interest Rate
5.96%
Mortgage Type
Seller Take Back
Create a Home Valuation Report for This Property
The Home Valuation Report is an in-depth analysis detailing your home's value as well as a comparison with similar homes in the area
Home Values in the Area
Average Home Value in this Area
Purchase History
| Date | Buyer | Sale Price | Title Company |
|---|---|---|---|
| Quante Gregory P | $195,000 | -- | |
| Gumm Raymond | $172,700 | -- |
Source: Public Records
Mortgage History
| Date | Status | Borrower | Loan Amount |
|---|---|---|---|
| Closed | Quante Gregory P | $175,000 |
Source: Public Records
Tax History
| Year | Tax Paid | Tax Assessment Tax Assessment Total Assessment is a certain percentage of the fair market value that is determined by local assessors to be the total taxable value of land and additions on the property. | Land | Improvement |
|---|---|---|---|---|
| 2025 | $7,191 | $122,297 | $47,614 | $74,683 |
| 2023 | $7,098 | $122,297 | $47,614 | $74,683 |
| 2022 | $6,256 | $88,106 | $36,274 | $51,832 |
| 2021 | $6,122 | $88,106 | $36,274 | $51,832 |
| 2020 | $5,664 | $88,106 | $36,274 | $51,832 |
| 2019 | $5,960 | $85,540 | $35,217 | $50,323 |
| 2018 | $6,008 | $85,540 | $35,217 | $50,323 |
| 2017 | $5,697 | $85,540 | $35,217 | $50,323 |
| 2016 | $4,112 | $58,195 | $15,579 | $42,616 |
| 2015 | $3,804 | $58,195 | $15,579 | $42,616 |
| 2014 | $3,826 | $58,195 | $15,579 | $42,616 |
| 2013 | $4,093 | $59,998 | $16,062 | $43,936 |
Source: Public Records
Map
Nearby Homes
- 6495 Dawson Rd
- 6752 Rose Crest Ave
- 7406 Dawson Rd
- 6095 Kenwood Rd
- 7469 Camargo Rd
- 7437 Madeira Pines Dr
- 6242 Fulsher Ln
- 7151 Euclid Ave
- 7474 Dawson Rd
- 5995 Crabtree Ln
- 7159 Hosbrook Rd
- 6041 Johnson St
- 7133 Fowler Ave
- 7317 Euclid Ave
- 7220 Mar Del Dr
- 7321 Hosbrook Rd
- 7752 Montgomery Rd
- 7335 Demar Rd
- 6300 Miami Rd
- 7156 Maple Ave
- 6545 Apache Cir
- 6537 Apache Cir
- 6660 Apache Cir
- 6551 Apache Cir
- 6664 Apache Cir
- 6654 Apache Cir
- 6535 Apache Cir
- 6542 Apache Cir
- 6548 Apache Cir
- 6670 Apache Cir
- 6650 Apache Cir
- 6536 Apache Cir
- 6555 Apache Cir
- 6533 Apache Cir
- 6532 Apache Cir
- 6644 Apache Cir
- 6680 Apache Cir
- 6686 Apache Cir
- 6552 Apache Cir
- 6559 Apache Cir
Your Personal Tour Guide
Ask me questions while you tour the home.