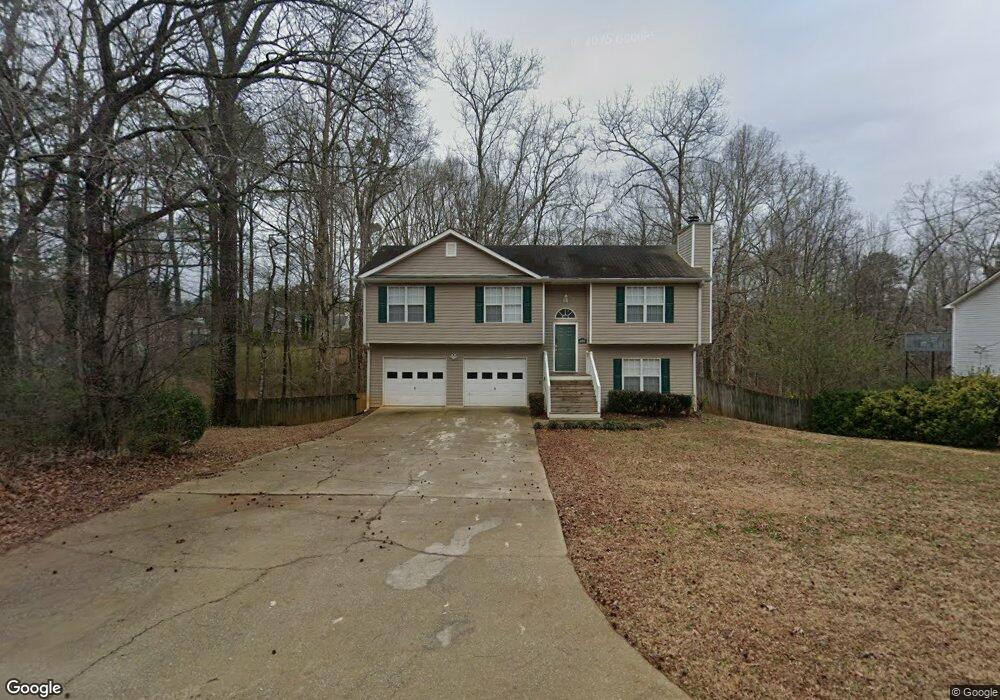
6541 Chickasaw Dr Unit 1 Douglasville, GA 30135
Bill Arp NeighborhoodEstimated Value: $252,000 - $284,790
3
Beds
2
Baths
1,184
Sq Ft
$229/Sq Ft
Est. Value
About This Home
This home is located at 6541 Chickasaw Dr Unit 1, Douglasville, GA 30135 and is currently estimated at $271,448, approximately $229 per square foot. 6541 Chickasaw Dr Unit 1 is a home located in Douglas County with nearby schools including Bill Arp Elementary School, Yeager Middle School, and Alexander High School.
Ownership History
Date
Name
Owned For
Owner Type
Purchase Details
Closed on
Sep 30, 2016
Sold by
Firebird Sfe I Llc
Bought by
Home Sfr Borrower Llc
Current Estimated Value
Purchase Details
Closed on
Feb 4, 2016
Sold by
Prayor Jackie
Bought by
Firebird Sfe I Llc
Purchase Details
Closed on
Jan 31, 2005
Sold by
Williamson Cindy and Williamson Steven
Bought by
Bivins Dwight
Home Financials for this Owner
Home Financials are based on the most recent Mortgage that was taken out on this home.
Original Mortgage
$96,800
Interest Rate
8%
Mortgage Type
New Conventional
Purchase Details
Closed on
Jul 7, 2000
Sold by
Mesa Built Inc
Bought by
Williamson Cindy L and Williamson Steven R
Home Financials for this Owner
Home Financials are based on the most recent Mortgage that was taken out on this home.
Original Mortgage
$114,227
Interest Rate
8.17%
Mortgage Type
VA
Create a Home Valuation Report for This Property
The Home Valuation Report is an in-depth analysis detailing your home's value as well as a comparison with similar homes in the area
Home Values in the Area
Average Home Value in this Area
Purchase History
| Date | Buyer | Sale Price | Title Company |
|---|---|---|---|
| Home Sfr Borrower Llc | $457,183 | -- | |
| Firebird Sfe I Llc | $122,500 | -- | |
| Bivins Dwight | $121,000 | -- | |
| Williamson Cindy L | $110,900 | -- | |
| Mesa Built Inc | -- | -- |
Source: Public Records
Mortgage History
| Date | Status | Borrower | Loan Amount |
|---|---|---|---|
| Previous Owner | Bivins Dwight | $96,800 | |
| Previous Owner | Mesa Built Inc | $114,227 |
Source: Public Records
Tax History Compared to Growth
Tax History
| Year | Tax Paid | Tax Assessment Tax Assessment Total Assessment is a certain percentage of the fair market value that is determined by local assessors to be the total taxable value of land and additions on the property. | Land | Improvement |
|---|---|---|---|---|
| 2024 | $2,861 | $90,920 | $16,800 | $74,120 |
| 2023 | $2,861 | $90,920 | $16,800 | $74,120 |
| 2022 | $2,192 | $67,320 | $14,000 | $53,320 |
| 2021 | $1,923 | $58,960 | $14,680 | $44,280 |
| 2020 | $1,918 | $57,840 | $10,760 | $47,080 |
| 2019 | $1,754 | $56,640 | $10,760 | $45,880 |
| 2018 | $1,635 | $52,560 | $10,760 | $41,800 |
| 2017 | $1,366 | $43,080 | $9,720 | $33,360 |
| 2016 | $1,149 | $35,600 | $8,309 | $27,291 |
| 2015 | $1,027 | $31,160 | $7,520 | $23,640 |
| 2014 | $811 | $24,120 | $6,240 | $17,880 |
| 2013 | -- | $26,920 | $6,960 | $19,960 |
Source: Public Records
Map
Nearby Homes
- 6560 Chickasaw Dr
- 4619 S Seminole Dr
- 6441 Michell Way
- 6755 Alexander Pkwy
- 6374 Dorsett Shoals Rd
- 6797 Greenoak Dr
- 6266 Dorsett Shoals Rd Unit 139
- 4450 Poplar Ct Unit 3
- 4430 Poplar Ct
- 6851 Alexander Pkwy
- 6290 S Skyline Dr
- 6590 Manor Creek Dr
- 6150 S Skyline Dr
- 6867 Laurelwood Dr
- 4776 Harrod Ct
- 6394 Shore Dr
- 6407 Shore Dr
- 6541 Chickasaw Dr
- 6541 Chickasaw Dr
- 6541 Chickasaw Dr
- 6551 Chickasaw Dr Unit 2
- 6551 Chickasaw Dr
- 4611 Choctaw Dr
- 6555 Chickasaw Dr
- 4619 Choctaw Dr
- 6550 Chickasaw Dr Unit Tr
- 6550 Chickasaw Dr
- 0 Choctaw Dr Unit 7091238
- 0 Choctaw Dr Unit 3180631
- 0 Choctaw Dr Unit 3174307
- 0 Choctaw Dr Unit 7587332
- 0 Choctaw Dr
- 6550 Chickasaw Dr Unit TR
- 6550 Chickasaw Dr
- 6540 Chickasaw Dr
- 4631 Choctaw Dr
- 6530 Chickasaw Dr