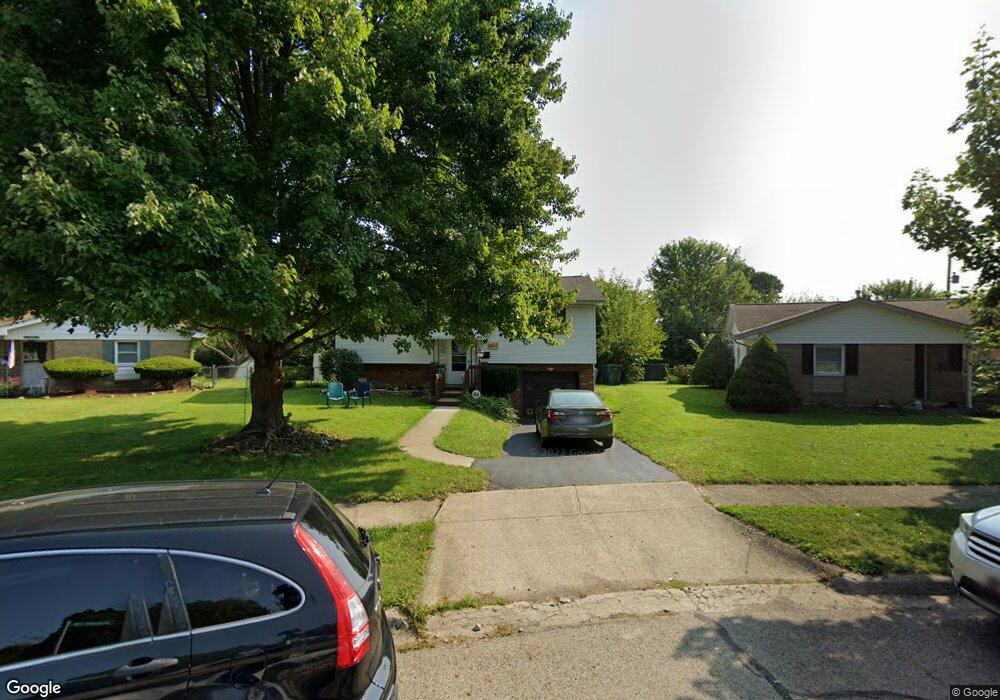
6542 Dobson Square E Columbus, OH 43229
Devonshire NeighborhoodEstimated Value: $228,000 - $254,000
3
Beds
2
Baths
992
Sq Ft
$240/Sq Ft
Est. Value
About This Home
This home is located at 6542 Dobson Square E, Columbus, OH 43229 and is currently estimated at $238,174, approximately $240 per square foot. 6542 Dobson Square E is a home located in Franklin County with nearby schools including Devonshire Alternative Elementary School, Woodward Park Middle School, and Beechcroft High School.
Ownership History
Date
Name
Owned For
Owner Type
Purchase Details
Closed on
Jul 17, 2024
Sold by
Antill Justin and Antill Alexandra
Bought by
Antill Justin and Antill Alexandra
Current Estimated Value
Purchase Details
Closed on
Jun 25, 2021
Sold by
Leaper Dmello Paula and Leaper Shuck Sa L
Bought by
Antill Justin and Antill Alexandra
Home Financials for this Owner
Home Financials are based on the most recent Mortgage that was taken out on this home.
Original Mortgage
$166,250
Interest Rate
2.9%
Mortgage Type
New Conventional
Purchase Details
Closed on
Aug 18, 2006
Sold by
Leaper Paul R and Leaper Betty J
Bought by
Leaper Betty J
Purchase Details
Closed on
Mar 12, 1964
Bought by
Leaper Paul R and Leaper Betty J
Create a Home Valuation Report for This Property
The Home Valuation Report is an in-depth analysis detailing your home's value as well as a comparison with similar homes in the area
Home Values in the Area
Average Home Value in this Area
Purchase History
| Date | Buyer | Sale Price | Title Company |
|---|---|---|---|
| Antill Justin | -- | None Listed On Document | |
| Antill Justin | $175,000 | Axxis Title Agency Ltd | |
| Leaper Betty J | -- | Chelsea Tit | |
| Leaper Paul R | -- | -- |
Source: Public Records
Mortgage History
| Date | Status | Borrower | Loan Amount |
|---|---|---|---|
| Previous Owner | Antill Justin | $166,250 |
Source: Public Records
Tax History
| Year | Tax Paid | Tax Assessment Tax Assessment Total Assessment is a certain percentage of the fair market value that is determined by local assessors to be the total taxable value of land and additions on the property. | Land | Improvement |
|---|---|---|---|---|
| 2025 | $3,444 | $75,150 | $20,130 | $55,020 |
| 2024 | $3,444 | $75,150 | $20,130 | $55,020 |
| 2023 | $3,330 | $75,145 | $20,125 | $55,020 |
| 2022 | $2,523 | $48,200 | $14,840 | $33,360 |
| 2021 | $2,050 | $48,200 | $14,840 | $33,360 |
| 2020 | $2,052 | $48,200 | $14,840 | $33,360 |
| 2019 | $1,828 | $38,890 | $11,870 | $27,020 |
| 2018 | $1,576 | $38,890 | $11,870 | $27,020 |
| 2017 | $1,645 | $38,890 | $11,870 | $27,020 |
| 2016 | $1,463 | $30,840 | $9,000 | $21,840 |
| 2015 | $1,328 | $30,840 | $9,000 | $21,840 |
| 2014 | $1,332 | $30,840 | $9,000 | $21,840 |
| 2013 | $759 | $34,265 | $10,010 | $24,255 |
Source: Public Records
Map
Nearby Homes
- 1421 Bosworth Place
- 6416 Faircrest Rd
- 1322 Bolenhill Ct
- 6336 Archmere Square E
- 6425 Deer Ridge Ln
- 6233 Karl Rd
- 1852 Balsamridge Rd
- 6166 Harrington Ct
- 1946 Rockdale Dr Unit 57
- 1947 Rockdale Dr Unit 33
- 6148 Sharon Woods Blvd
- 1288 Oakfield Dr N
- 6162 Oakfield Dr E
- 6245 Sharon Woods Blvd
- 6035 Karl Rd
- 6189 Northgap Dr
- 6211 Parkdale Dr
- 5990 Ambleside Dr
- 6019 Beechcroft Rd
- 2125 Keltonshire Ave
- 1502 Dobson Square N
- 6536 Dobson Square E
- 6539 Karl Rd
- 6547 Karl Rd
- 1498 Dobson Square N
- 6528 Dobson Square E
- 6531 Karl Rd
- 6555 Karl Rd
- 6523 Karl Rd
- 1491 Dobson Square N
- 1490 Dobson Square N
- 6520 Dobson Square E
- 6533 Dobson Square E
- 6515 Karl Rd
- 6512 Dobson Square E
- 6590 Barrett Ln
- 6525 Dobson Square E
- 6571 Karl Rd
- 1486 Dobson Square N
- 6507 Karl Rd
Your Personal Tour Guide
Ask me questions while you tour the home.