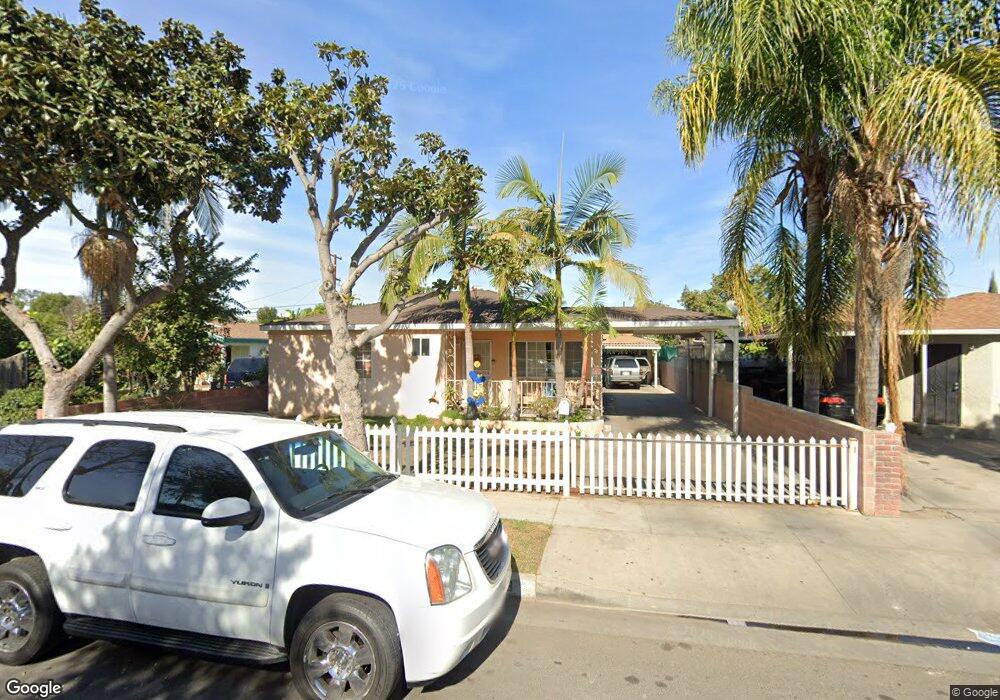
6543 San Luis St Paramount, CA 90723
Estimated Value: $666,960 - $780,000
3
Beds
2
Baths
1,507
Sq Ft
$490/Sq Ft
Est. Value
About This Home
This home is located at 6543 San Luis St, Paramount, CA 90723 and is currently estimated at $737,990, approximately $489 per square foot. 6543 San Luis St is a home located in Los Angeles County with nearby schools including Mark Keppel School, Frank J. Zamboni School, and Paramount High School.
Ownership History
Date
Name
Owned For
Owner Type
Purchase Details
Closed on
May 15, 2001
Sold by
Salazar Carlos H and Salazar Rosemary
Bought by
Martinez Jose Luis and Martinez Eloisa
Current Estimated Value
Home Financials for this Owner
Home Financials are based on the most recent Mortgage that was taken out on this home.
Original Mortgage
$162,450
Outstanding Balance
$61,152
Interest Rate
7.14%
Mortgage Type
FHA
Estimated Equity
$676,838
Purchase Details
Closed on
Jun 21, 1996
Sold by
Hernandez Francisco and Hernandez Amelia
Bought by
Salazar Carlos H and Salazar Rosemary
Create a Home Valuation Report for This Property
The Home Valuation Report is an in-depth analysis detailing your home's value as well as a comparison with similar homes in the area
Home Values in the Area
Average Home Value in this Area
Purchase History
| Date | Buyer | Sale Price | Title Company |
|---|---|---|---|
| Martinez Jose Luis | $165,000 | First American Title Co | |
| Salazar Carlos H | -- | -- |
Source: Public Records
Mortgage History
| Date | Status | Borrower | Loan Amount |
|---|---|---|---|
| Open | Martinez Jose Luis | $162,450 |
Source: Public Records
Tax History
| Year | Tax Paid | Tax Assessment Tax Assessment Total Assessment is a certain percentage of the fair market value that is determined by local assessors to be the total taxable value of land and additions on the property. | Land | Improvement |
|---|---|---|---|---|
| 2025 | $3,560 | $248,607 | $160,469 | $88,138 |
| 2024 | $3,560 | $243,733 | $157,323 | $86,410 |
| 2023 | $3,498 | $238,955 | $154,239 | $84,716 |
| 2022 | $3,407 | $234,270 | $151,215 | $83,055 |
| 2021 | $3,327 | $229,677 | $148,250 | $81,427 |
| 2019 | $3,400 | $222,866 | $143,853 | $79,013 |
| 2018 | $3,120 | $218,497 | $141,033 | $77,464 |
| 2016 | $2,802 | $210,014 | $135,557 | $74,457 |
| 2015 | $2,650 | $206,860 | $133,521 | $73,339 |
| 2014 | $2,714 | $202,809 | $130,906 | $71,903 |
Source: Public Records
Map
Nearby Homes
- 6542 San Luis St
- 6556 San Vincente St
- 15325 Orange Ave
- 7032 Somerset Blvd
- 15351 Orange Ave Unit 17
- 15137 Gundry Ave Unit F
- 6656 Rosecrans Ave Unit N-10
- 15211 S Gibson Ave
- 4810 E San Luis St
- 14944 Texaco Ave
- 4934 E San Rafael St
- 4623 E Compton Blvd
- 6733 Caro St Unit 47
- 14625 S Frailey Ave
- 16101 Ansmith Ave
- 14630 S Lime Ave
- 15412 S Atlantic Ave
- 6535 E 72nd St Unit 1
- 6824 Marcelle St
- 12617 S Halo Dr
- 6549 San Luis St
- 6537 San Luis St
- 6553 San Luis St
- 6531 San Luis St
- 6542 San Marcus St
- 6538 San Marcus St
- 6548 San Marcus St
- 14913 San Jose Ave
- 6527 San Luis St
- 6552 San Marcus St
- 6530 San Marcus St
- 6546 San Luis St
- 6536 San Luis St
- 6526 San Marcus St
- 14905 San Jose Ave
- 6523 San Luis St
- 6550 San Luis St
- 6530 San Luis St
- 15005 San Jose Ave
- 6522 San Marcus St
Your Personal Tour Guide
Ask me questions while you tour the home.