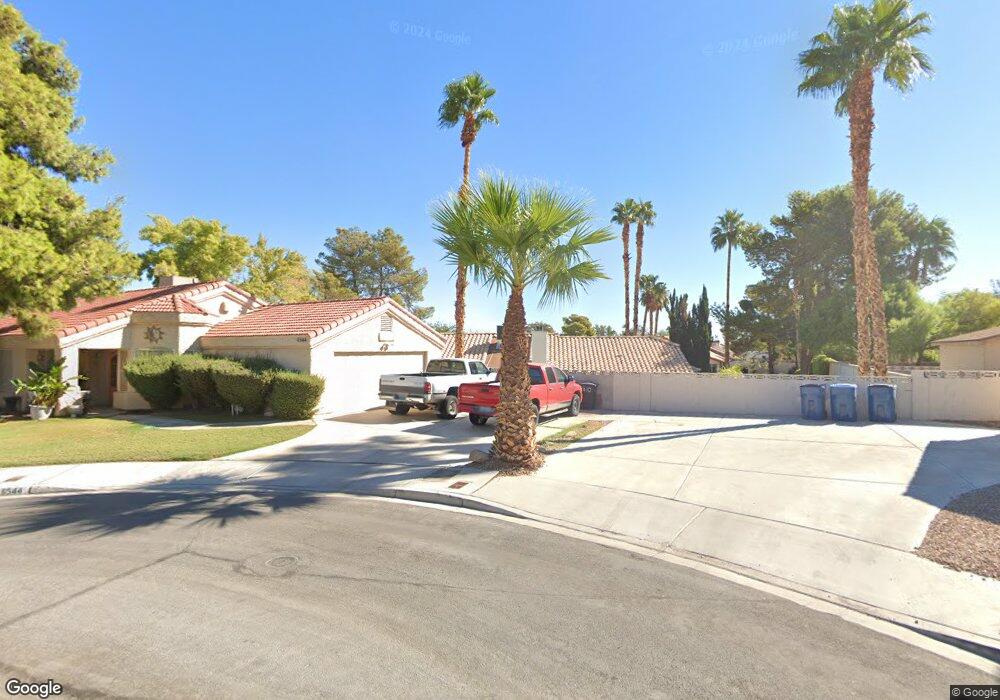
6544 Silver Penny Ave Las Vegas, NV 89108
Michael Way NeighborhoodEstimated Value: $341,000 - $366,000
2
Beds
2
Baths
1,204
Sq Ft
$293/Sq Ft
Est. Value
About This Home
This home is located at 6544 Silver Penny Ave, Las Vegas, NV 89108 and is currently estimated at $353,168, approximately $293 per square foot. 6544 Silver Penny Ave is a home located in Clark County with nearby schools including Berkeley L. Bunker Elementary School, Irwin & Susan Molasky Junior High School, and Cimarron Memorial High School.
Ownership History
Date
Name
Owned For
Owner Type
Purchase Details
Closed on
Mar 9, 2011
Sold by
Hanson Dennis R
Bought by
Hanson Allan and Hanson Erika
Current Estimated Value
Purchase Details
Closed on
Oct 21, 2008
Sold by
Hanson Claudine
Bought by
Hanson Dennis R
Purchase Details
Closed on
Aug 25, 2008
Sold by
Toro Alfredo A and Maceo Ana B
Bought by
Hsbc Bank Usa Na and Ace Securities Corp Home Equity Loan Tr
Purchase Details
Closed on
Apr 5, 2006
Sold by
Rose Rebecca Joan
Bought by
Toro Alfredo A and Maceo Ana B
Home Financials for this Owner
Home Financials are based on the most recent Mortgage that was taken out on this home.
Original Mortgage
$208,000
Interest Rate
7.65%
Mortgage Type
Unknown
Create a Home Valuation Report for This Property
The Home Valuation Report is an in-depth analysis detailing your home's value as well as a comparison with similar homes in the area
Home Values in the Area
Average Home Value in this Area
Purchase History
| Date | Buyer | Sale Price | Title Company |
|---|---|---|---|
| Hanson Allan | -- | None Available | |
| Hanson Dennis R | -- | First American Title Paseo V | |
| Hanson Dennis R | $126,900 | First American Title Paseo V | |
| Hsbc Bank Usa Na | $136,000 | Fidelity National Default So | |
| Toro Alfredo A | $260,000 | Southwest Title |
Source: Public Records
Mortgage History
| Date | Status | Borrower | Loan Amount |
|---|---|---|---|
| Previous Owner | Toro Alfredo A | $208,000 |
Source: Public Records
Tax History Compared to Growth
Tax History
| Year | Tax Paid | Tax Assessment Tax Assessment Total Assessment is a certain percentage of the fair market value that is determined by local assessors to be the total taxable value of land and additions on the property. | Land | Improvement |
|---|---|---|---|---|
| 2025 | $1,452 | $64,114 | $26,250 | $37,864 |
| 2024 | $1,345 | $64,114 | $26,250 | $37,864 |
| 2023 | $1,345 | $63,125 | $26,600 | $36,525 |
| 2022 | $1,246 | $55,257 | $21,700 | $33,557 |
| 2021 | $1,154 | $52,489 | $20,300 | $32,189 |
| 2020 | $1,069 | $51,748 | $19,600 | $32,148 |
| 2019 | $1,002 | $48,701 | $16,800 | $31,901 |
| 2018 | $956 | $44,209 | $13,300 | $30,909 |
| 2017 | $896 | $44,046 | $12,600 | $31,446 |
| 2016 | $896 | $42,875 | $10,850 | $32,025 |
| 2015 | $893 | $37,224 | $7,000 | $30,224 |
| 2014 | $867 | $25,651 | $5,600 | $20,051 |
Source: Public Records
Map
Nearby Homes
- 6544 Old Oxford Ave
- 6612 Gentle Winds Ct
- 3100 Garehime St
- 6632 Light Breeze Dr
- 6612 Old Newbury Ave
- 3116 Gentle Breeze St
- 6632 Coastal Breeze Ct
- 2809 Du Barry Manor Ln
- 2912 Drury St
- 6536 Castor Tree Way
- 2789 Trotwood Ln
- 2764 Trotwood Ln
- 6428 Yarmouth Dr
- 2801 N Rainbow Blvd Unit 252
- 2801 N Rainbow Blvd Unit 103
- 2801 N Rainbow Blvd Unit 273
- 2700 N Rainbow Blvd Unit 1137
- 6561 Avon Ct
- 3265 Mustang St
- 2915 Maverick St
- 6548 Silver Penny Ave
- 6533 W Brooks Ave
- 3001 Garehime St
- 6545 Silver Penny Ave Unit II
- 3000 Gentle Breeze St
- 6552 Silver Penny Ave
- 6549 Silver Penny Ave
- 6540 Old Oxford Ave
- 6540 Old Oxford Ave Unit n/a
- 6601 Gentle Winds Ct
- 6536 Old Oxford Ave Unit II
- 3011 Garehime St
- 6525 W Brooks Ave
- 3004 Gentle Breeze St
- 6532 Old Oxford Ave
- 6548 Old Oxford Ave Unit II
- 6601 Silver Penny Ave
- 6552 Old Oxford Ave
- 6605 Gentle Winds Ct
- 6528 Old Oxford Ave