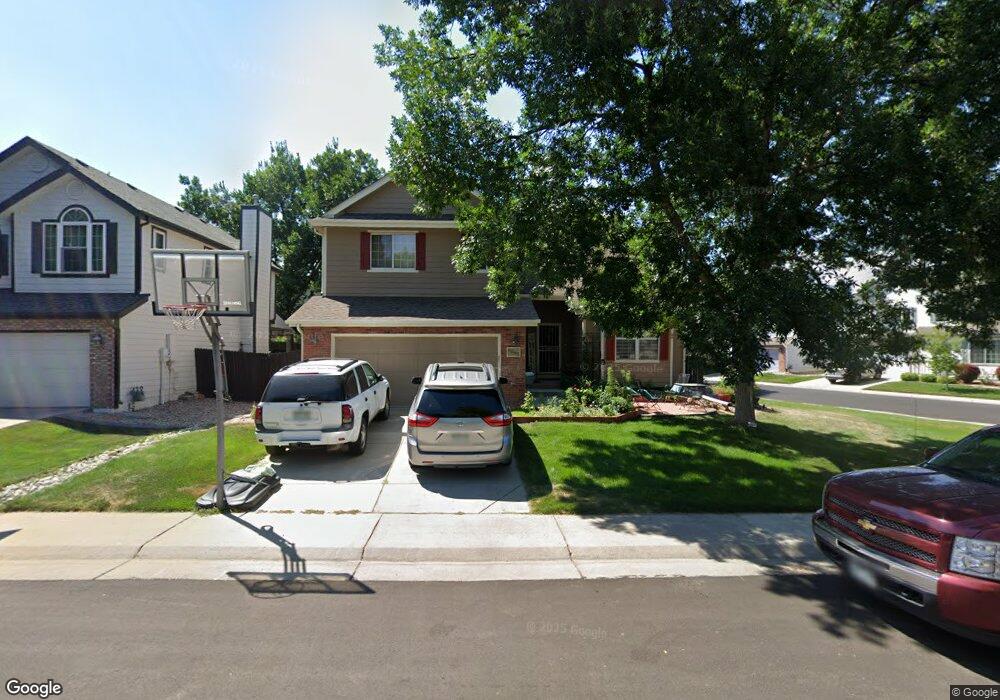
6545 Deframe Way Arvada, CO 80004
Ralston Valley NeighborhoodEstimated Value: $632,000 - $691,000
3
Beds
3
Baths
2,627
Sq Ft
$249/Sq Ft
Est. Value
About This Home
This home is located at 6545 Deframe Way, Arvada, CO 80004 and is currently estimated at $653,905, approximately $248 per square foot. 6545 Deframe Way is a home located in Jefferson County with nearby schools including Stott Elementary School, Oberon Middle School, and Arvada West High School.
Ownership History
Date
Name
Owned For
Owner Type
Purchase Details
Closed on
Feb 8, 2010
Sold by
Tran Binh N and Shing Melanie M
Bought by
Wasinger Mark A and Wasinger Karen M
Current Estimated Value
Home Financials for this Owner
Home Financials are based on the most recent Mortgage that was taken out on this home.
Original Mortgage
$200,000
Outstanding Balance
$133,224
Interest Rate
5.16%
Mortgage Type
New Conventional
Estimated Equity
$520,681
Purchase Details
Closed on
Apr 14, 2000
Sold by
Kara Boatright Brian D Boatright
Bought by
Tran Binh N and Shing Melanie M
Home Financials for this Owner
Home Financials are based on the most recent Mortgage that was taken out on this home.
Original Mortgage
$223,061
Interest Rate
8.27%
Mortgage Type
FHA
Purchase Details
Closed on
May 19, 1994
Sold by
Village Homes Of Colorado Inc
Bought by
Boatright Brian D and Boatright Kara
Home Financials for this Owner
Home Financials are based on the most recent Mortgage that was taken out on this home.
Original Mortgage
$129,100
Interest Rate
8.4%
Create a Home Valuation Report for This Property
The Home Valuation Report is an in-depth analysis detailing your home's value as well as a comparison with similar homes in the area
Home Values in the Area
Average Home Value in this Area
Purchase History
| Date | Buyer | Sale Price | Title Company |
|---|---|---|---|
| Wasinger Mark A | $270,000 | Security Title | |
| Tran Binh N | $224,900 | Land Title Guarantee Company | |
| Boatright Brian D | $143,446 | Land Title |
Source: Public Records
Mortgage History
| Date | Status | Borrower | Loan Amount |
|---|---|---|---|
| Open | Wasinger Mark A | $200,000 | |
| Previous Owner | Tran Binh N | $223,061 | |
| Previous Owner | Boatright Brian D | $129,100 |
Source: Public Records
Tax History
| Year | Tax Paid | Tax Assessment Tax Assessment Total Assessment is a certain percentage of the fair market value that is determined by local assessors to be the total taxable value of land and additions on the property. | Land | Improvement |
|---|---|---|---|---|
| 2024 | $3,718 | $38,336 | $17,295 | $21,041 |
| 2023 | $3,718 | $38,336 | $17,295 | $21,041 |
| 2022 | $3,369 | $34,399 | $13,861 | $20,538 |
| 2021 | $3,425 | $35,389 | $14,260 | $21,129 |
| 2020 | $3,061 | $31,720 | $12,331 | $19,389 |
| 2019 | $3,020 | $31,720 | $12,331 | $19,389 |
| 2018 | $2,838 | $28,985 | $9,212 | $19,773 |
| 2017 | $2,598 | $28,985 | $9,212 | $19,773 |
| 2016 | $2,506 | $26,334 | $6,848 | $19,486 |
| 2015 | $2,328 | $26,334 | $6,848 | $19,486 |
| 2014 | $2,328 | $22,991 | $6,625 | $16,366 |
Source: Public Records
Map
Nearby Homes
- 13812 W 64th Place
- 13750 W 65th Ave
- 13400 W 65th Ave
- 6658 Cole Ct
- 13334 W 65th Dr
- 6369 Cole Ln
- 13294 W 65th Dr
- 6363 Cole Ln
- 6304 Deframe Way
- 6725 Beech Ct
- 6329 Braun Cir
- 13275 W 63rd Place
- 13509 W 62nd Dr
- 14050 W 68th Ave
- 6762 Beech Dr
- 13155 W 63rd Place
- 6409 Zang St Unit A
- 6262 Braun Cir
- 13844 W 68th Dr
- 6060 Deframe Ct
- 6535 Deframe Way
- 6538 Devinney St
- 6525 Deframe Way
- 13877 W 65th Dr
- 6534 Deframe Way
- 13867 W 65th Dr
- 6528 Devinney St
- 13887 W 65th Dr
- 6544 Deframe Way
- 6524 Deframe Way
- 13857 W 65th Dr
- 6515 Deframe Way
- 13897 W 65th Dr
- 6514 Deframe Way
- 6518 Devinney St
- 13847 W 65th Dr
- 6505 Deframe Way
- 6504 Deframe Way
- 13907 W 65th Dr
- 6541 Deframe Ct
Your Personal Tour Guide
Ask me questions while you tour the home.