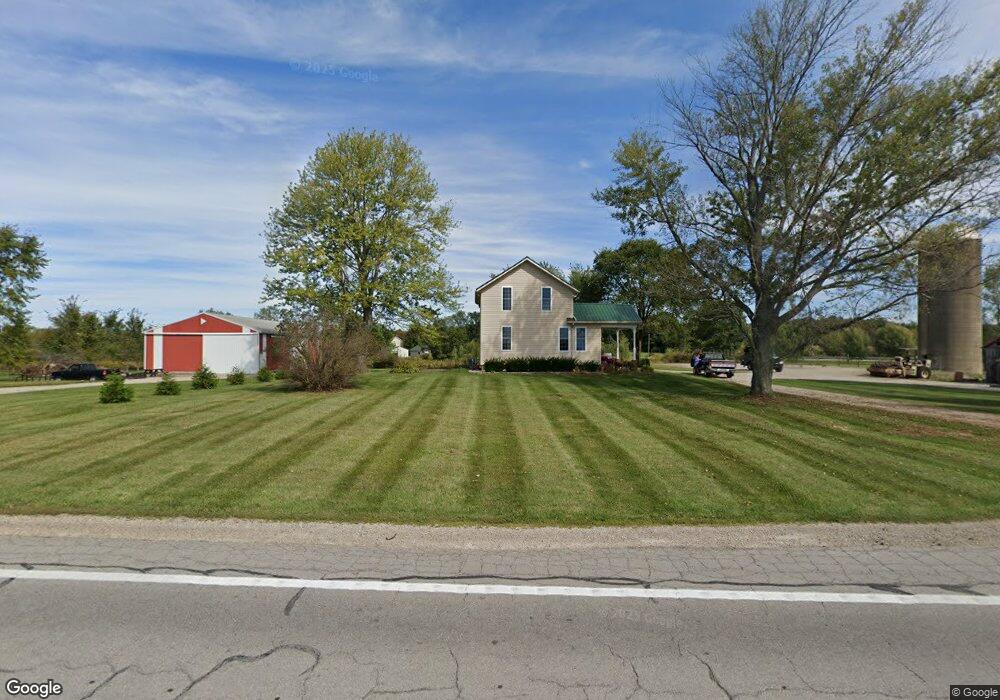
6548 State Route 18 E New London, OH 44851
Estimated Value: $244,217 - $293,000
3
Beds
2
Baths
2,008
Sq Ft
$132/Sq Ft
Est. Value
About This Home
This home is located at 6548 State Route 18 E, New London, OH 44851 and is currently estimated at $265,554, approximately $132 per square foot. 6548 State Route 18 E is a home located in Huron County with nearby schools including Westwood Elementary School, McCormick Middle School, and Wellington High School.
Ownership History
Date
Name
Owned For
Owner Type
Purchase Details
Closed on
Mar 15, 2013
Bought by
Andrew L Fahler
Current Estimated Value
Purchase Details
Closed on
Mar 12, 2013
Sold by
Stoner Nancy L
Bought by
Fahler Andrew L
Purchase Details
Closed on
Aug 26, 2003
Bought by
Stoner Nancy L
Purchase Details
Closed on
Mar 27, 2003
Bought by
Stoner Nancy L
Purchase Details
Closed on
Dec 10, 1996
Sold by
King Robert L
Bought by
Mcdonald Tony and Mcdonald Shona R
Purchase Details
Closed on
Jan 9, 1996
Bought by
King Robert L
Purchase Details
Closed on
Sep 6, 1995
Sold by
Wacker Paul D
Bought by
King Robert L
Home Financials for this Owner
Home Financials are based on the most recent Mortgage that was taken out on this home.
Original Mortgage
$170,000
Interest Rate
7.76%
Mortgage Type
New Conventional
Create a Home Valuation Report for This Property
The Home Valuation Report is an in-depth analysis detailing your home's value as well as a comparison with similar homes in the area
Home Values in the Area
Average Home Value in this Area
Purchase History
| Date | Buyer | Sale Price | Title Company |
|---|---|---|---|
| Andrew L Fahler | $30,000 | -- | |
| Fahler Andrew L | $68,329 | Attorney | |
| Stoner Nancy L | -- | -- | |
| Stoner Nancy L | $77,000 | -- | |
| Mcdonald Tony | $104,000 | -- | |
| King Robert L | -- | -- | |
| King Robert L | $170,000 | -- |
Source: Public Records
Mortgage History
| Date | Status | Borrower | Loan Amount |
|---|---|---|---|
| Previous Owner | King Robert L | $170,000 |
Source: Public Records
Tax History Compared to Growth
Tax History
| Year | Tax Paid | Tax Assessment Tax Assessment Total Assessment is a certain percentage of the fair market value that is determined by local assessors to be the total taxable value of land and additions on the property. | Land | Improvement |
|---|---|---|---|---|
| 2024 | $2,127 | $61,550 | $12,020 | $49,530 |
| 2023 | $2,127 | $48,770 | $9,160 | $39,610 |
| 2022 | $1,757 | $48,770 | $9,160 | $39,610 |
| 2021 | $1,761 | $48,770 | $9,160 | $39,610 |
| 2020 | $1,430 | $38,040 | $7,190 | $30,850 |
| 2019 | $1,427 | $38,040 | $7,190 | $30,850 |
| 2018 | $1,441 | $38,040 | $7,190 | $30,850 |
| 2017 | $1,487 | $37,840 | $6,500 | $31,340 |
| 2016 | $1,464 | $37,840 | $6,500 | $31,340 |
| 2015 | $630 | $37,160 | $6,500 | $30,660 |
| 2014 | $652 | $29,120 | $6,510 | $22,610 |
| 2013 | $1,418 | $35,390 | $6,510 | $28,880 |
Source: Public Records
Map
Nearby Homes
- 20011 Gore Orphanage Rd
- 22697 Gore Orphanage Rd
- 0 Butler Rd N
- 1491 Vesta Rd
- 52025 Betts Rd
- 20303 Mosher Rd
- 18315 Gifford Rd
- 816 Butler Rd S
- 20765 Quarry Rd
- 202 S State St
- 1195 Fitchville River Rd
- 4718 Brushwood Rd
- 5429 & 5431 St Rt 303
- 34 Cherdon Cir
- 5810 U S 20 Unit 17
- 5810 U S 20 Unit 72
- 5810 U S 20 Unit 98
- 5810 U S 20 Unit 111
- 5810 U S 20 Unit 3
- 30 S River St
- 1441 Butler Rd
- 1457 Butler Rd
- 1493 Butler Rd
- 1430 Butler Rd
- 1405 Butler Rd N
- 1525 Butler Rd
- 1545 Butler Rd
- 1373 Butler Rd N
- 6633 Ohio 18
- 6633 State Route 18 E
- 1565 Butler Rd
- 1550 Butler Rd
- 6445 State Route 18 E
- 6641 Sr 18
- 6590 Ferry Rd
- 1576 Butler Rd
- 1576 Butler Rd
- 1577 Butler Rd
- 6579 Ferry Rd
- 6672 State Route 18 E