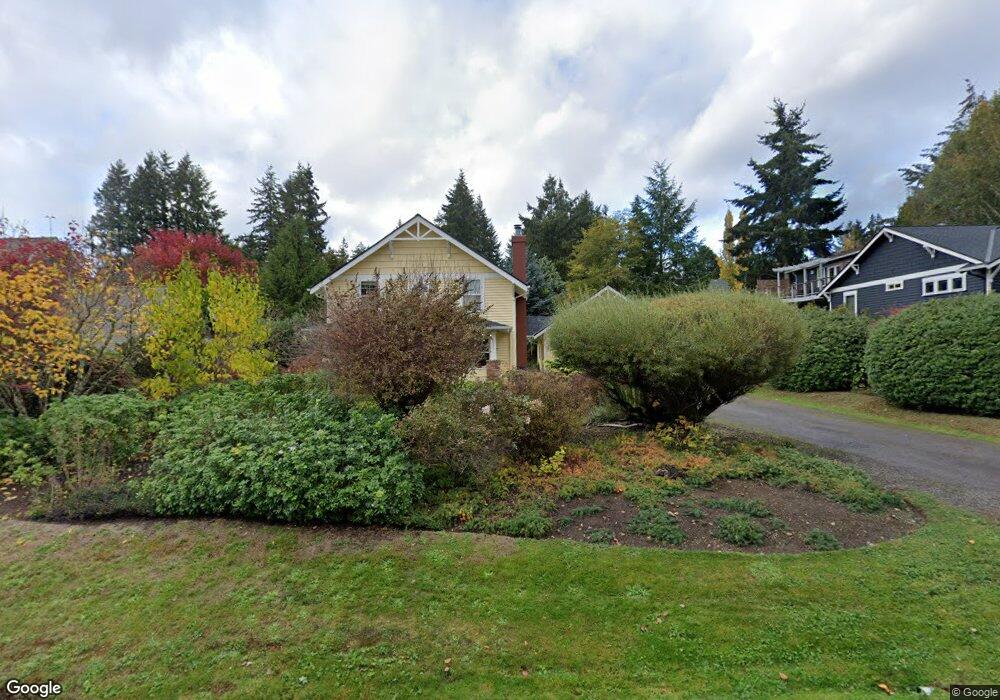
655 Al Dorsey Ln NW Bainbridge Island, WA 98110
Estimated Value: $1,136,000 - $1,515,000
3
Beds
3
Baths
1,814
Sq Ft
$722/Sq Ft
Est. Value
About This Home
This home is located at 655 Al Dorsey Ln NW, Bainbridge Island, WA 98110 and is currently estimated at $1,309,134, approximately $721 per square foot. 655 Al Dorsey Ln NW is a home located in Kitsap County with nearby schools including Bainbridge High School, Madrona School, and St. Cecilia Catholic School.
Ownership History
Date
Name
Owned For
Owner Type
Purchase Details
Closed on
Jul 31, 2017
Sold by
Purdy William P and Costa Michele M
Bought by
Purdy William P
Current Estimated Value
Home Financials for this Owner
Home Financials are based on the most recent Mortgage that was taken out on this home.
Original Mortgage
$266,000
Outstanding Balance
$221,476
Interest Rate
3.88%
Mortgage Type
New Conventional
Estimated Equity
$1,087,658
Purchase Details
Closed on
Aug 18, 2003
Sold by
Maxwell Paula Christine
Bought by
Purdy William P and Costa Michele M
Home Financials for this Owner
Home Financials are based on the most recent Mortgage that was taken out on this home.
Original Mortgage
$244,650
Interest Rate
2.45%
Mortgage Type
Purchase Money Mortgage
Purchase Details
Closed on
Jun 6, 1996
Sold by
Spellman Construction Inc
Bought by
Maxwell Paula Christine
Home Financials for this Owner
Home Financials are based on the most recent Mortgage that was taken out on this home.
Original Mortgage
$128,000
Interest Rate
7.96%
Create a Home Valuation Report for This Property
The Home Valuation Report is an in-depth analysis detailing your home's value as well as a comparison with similar homes in the area
Home Values in the Area
Average Home Value in this Area
Purchase History
| Date | Buyer | Sale Price | Title Company |
|---|---|---|---|
| Purdy William P | $281 | None Available | |
| Purdy William P | $349,500 | First American Title Ins | |
| Maxwell Paula Christine | $221,900 | Land Title Co |
Source: Public Records
Mortgage History
| Date | Status | Borrower | Loan Amount |
|---|---|---|---|
| Open | Purdy William P | $266,000 | |
| Previous Owner | Purdy William P | $244,650 | |
| Previous Owner | Maxwell Paula Christine | $128,000 |
Source: Public Records
Tax History Compared to Growth
Tax History
| Year | Tax Paid | Tax Assessment Tax Assessment Total Assessment is a certain percentage of the fair market value that is determined by local assessors to be the total taxable value of land and additions on the property. | Land | Improvement |
|---|---|---|---|---|
| 2026 | $8,894 | $1,097,980 | $315,280 | $782,700 |
| 2025 | $8,894 | $1,097,980 | $315,280 | $782,700 |
| 2024 | $8,500 | $1,097,980 | $315,280 | $782,700 |
| 2023 | $8,870 | $1,097,980 | $315,280 | $782,700 |
| 2022 | $8,281 | $873,180 | $233,220 | $639,960 |
| 2021 | $8,147 | $819,360 | $218,370 | $600,990 |
| 2020 | $7,834 | $776,300 | $206,490 | $569,810 |
| 2019 | $7,210 | $727,860 | $193,120 | $534,740 |
| 2018 | $7,179 | $566,370 | $148,550 | $417,820 |
| 2017 | $5,928 | $566,370 | $148,550 | $417,820 |
| 2016 | $5,428 | $492,000 | $148,550 | $343,450 |
| 2015 | $4,683 | $431,560 | $129,770 | $301,790 |
| 2014 | -- | $395,340 | $129,770 | $265,570 |
| 2013 | -- | $370,500 | $121,230 | $249,270 |
Source: Public Records
Map
Nearby Homes
- 753 Village Cir NW
- 737 Village Cir NW
- 228 Canopy Path NW
- 1116 Grow Ave NW
- 224 Canopy Path NW
- 208 Shepard Way NW
- 8784 NE Winslow Grove Ct
- 204 Shepard Way NW
- 3 Bedroom Plan at Trillium, Grow Community | Bainbridge Island - The Trillium
- 2 Bedroom Plan at Trillium, Grow Community | Bainbridge Island - The Trillium
- 962 Dove Tail Ln NW Unit 3
- 1250 Weaver Rd NW Unit A8
- 115 Hall Brothers Loop NW Unit 203
- 213 Eakin Dr NW
- 360 Knechtel Way NE Unit 201
- 346 Wyatt Way NE Unit 10
- 8277 New Holland Ct NE
- 511 Groos Ln NE
- 752 NE Vineyard Ln Unit L205
- 300 High School Rd NE Unit 318
- 653 Al Dorsey Ln NW
- 657 Al Dorsey Ln NW
- 652 Pierce Ct NW
- 636 Pierce Ct NW
- 643 Annie Rose Ln NW
- 641 Annie Rose Ln NW
- 651 Al Dorsey Ln NW
- 580 Pierce Ct NW
- 659 Al Dorsey Ln NW
- 657 Annie Rose Ln NW
- 639 Annie Rose Ln NW
- 564 Pierce Ct NW
- 678 Pierce Ct NW
- 649 Al Dorsey Ln NW Unit ADU
- 663 Annie Rose Ln NW
- 661 Al Dorsey Ln NW
- 686 Pierce Ct NW
- 633 Pierce Ct NW
- 651 Pierce Ct NW
- 667 Pierce Ct NW