655 Canyon Rd Logan, UT 84321
Wilson NeighborhoodEstimated Value: $392,000 - $505,000
Studio
--
Bath
1,929
Sq Ft
$229/Sq Ft
Est. Value
About This Home
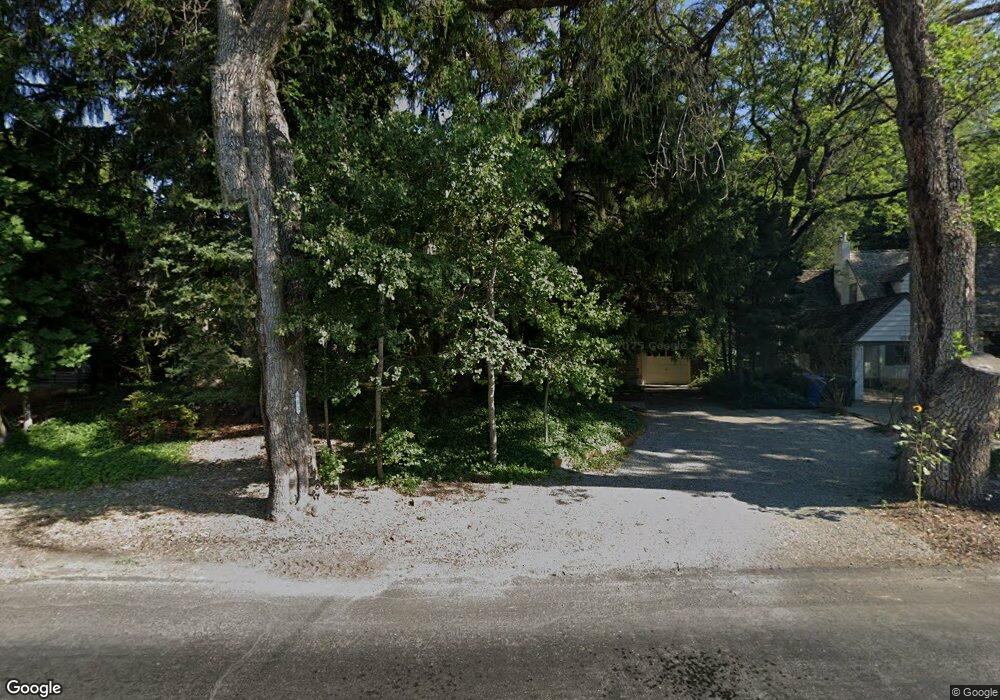
This home is located at 655 Canyon Rd, Logan, UT 84321 and is currently estimated at $441,853, approximately $229 per square foot. 655 Canyon Rd is a home with nearby schools including Wilson School, Mount Logan Middle School, and Logan High School.
Ownership History
Date
Name
Owned For
Owner Type
Purchase Details
Closed on
Oct 24, 2012
Sold by
Mcreynolds John A and Shultz Leila M
Bought by
Mcreynolds John A and Shultz Leila M
Current Estimated Value
Home Financials for this Owner
Home Financials are based on the most recent Mortgage that was taken out on this home.
Original Mortgage
$78,000
Interest Rate
3.5%
Mortgage Type
New Conventional
Purchase Details
Closed on
May 7, 2009
Sold by
Mcreynolds John A and Shultz Leila M
Bought by
Mcreynolds John A and Shultz Leila M
Home Financials for this Owner
Home Financials are based on the most recent Mortgage that was taken out on this home.
Original Mortgage
$88,500
Interest Rate
4.8%
Mortgage Type
New Conventional
Create a Home Valuation Report for This Property
The Home Valuation Report is an in-depth analysis detailing your home's value as well as a comparison with similar homes in the area
Home Values in the Area
Average Home Value in this Area
Purchase History
| Date | Buyer | Sale Price | Title Company |
|---|---|---|---|
| Mcreynolds John A | -- | Northern Title Company | |
| Mcreynolds John A | -- | Northern Title Company | |
| Mcreynolds John A | -- | Cache Title Company | |
| Mcreynolds John A | -- | Cache Title Company |
Source: Public Records
Mortgage History
| Date | Status | Borrower | Loan Amount |
|---|---|---|---|
| Closed | Mcreynolds John A | $78,000 | |
| Closed | Mcreynolds John A | $88,500 |
Source: Public Records
Tax History
| Year | Tax Paid | Tax Assessment Tax Assessment Total Assessment is a certain percentage of the fair market value that is determined by local assessors to be the total taxable value of land and additions on the property. | Land | Improvement |
|---|---|---|---|---|
| 2025 | $1,841 | $238,045 | $0 | $0 |
| 2024 | $1,888 | $236,510 | $0 | $0 |
| 2023 | $1,978 | $236,170 | $0 | $0 |
| 2022 | $2,073 | $231,155 | $0 | $0 |
| 2021 | $1,595 | $274,840 | $45,000 | $229,840 |
| 2020 | $1,431 | $221,800 | $45,000 | $176,800 |
| 2019 | $1,495 | $221,800 | $45,000 | $176,800 |
| 2018 | $1,617 | $218,936 | $45,000 | $173,936 |
| 2017 | $1,539 | $110,165 | $0 | $0 |
| 2016 | $1,595 | $105,765 | $0 | $0 |
| 2015 | $1,533 | $105,765 | $0 | $0 |
| 2014 | $1,386 | $105,765 | $0 | $0 |
| 2013 | -- | $103,625 | $0 | $0 |
Source: Public Records
Map
Nearby Homes
Your Personal Tour Guide
Ask me questions while you tour the home.