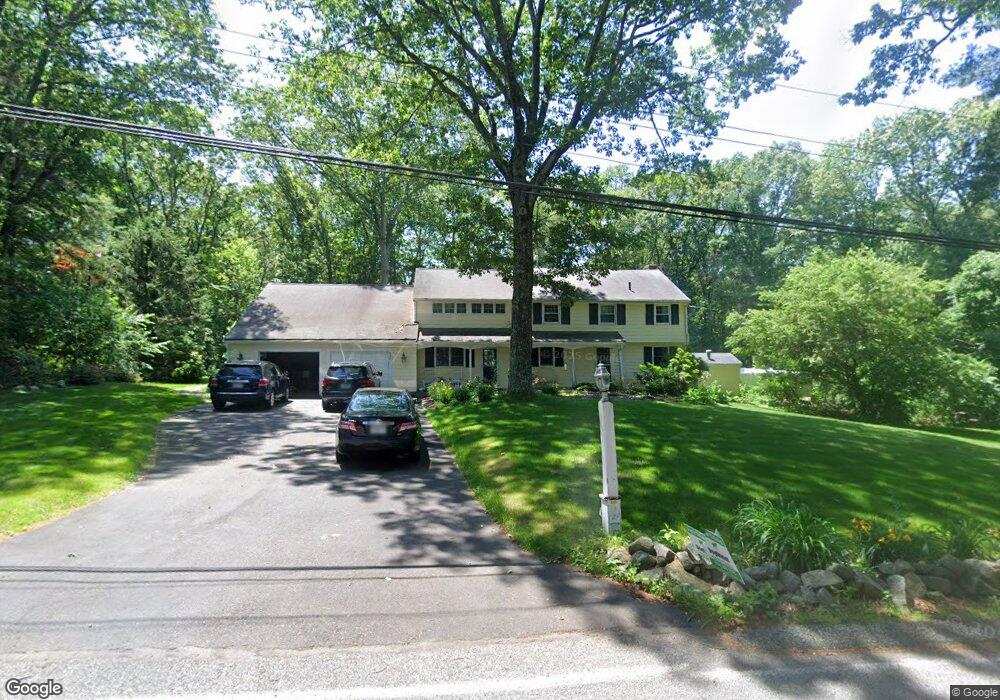
655 High St Walpole, MA 02081
Estimated Value: $977,000 - $1,224,000
3
Beds
2
Baths
2,594
Sq Ft
$413/Sq Ft
Est. Value
About This Home
This home is located at 655 High St, Walpole, MA 02081 and is currently estimated at $1,070,640, approximately $412 per square foot. 655 High St is a home located in Norfolk County with nearby schools including Elm Street School, Eleanor N. Johnson Middle School, and Walpole High School.
Ownership History
Date
Name
Owned For
Owner Type
Purchase Details
Closed on
Jul 29, 1997
Sold by
Mileszko John M and Mileszko Diane J
Bought by
Geoghegan Margaret M
Current Estimated Value
Purchase Details
Closed on
Oct 1, 1992
Sold by
Lorraine L Quinlan T
Bought by
Macero Diana J and Mileszko John M
Create a Home Valuation Report for This Property
The Home Valuation Report is an in-depth analysis detailing your home's value as well as a comparison with similar homes in the area
Home Values in the Area
Average Home Value in this Area
Purchase History
| Date | Buyer | Sale Price | Title Company |
|---|---|---|---|
| Geoghegan Margaret M | $251,500 | -- | |
| Macero Diana J | $170,000 | -- |
Source: Public Records
Mortgage History
| Date | Status | Borrower | Loan Amount |
|---|---|---|---|
| Open | Macero Diana J | $272,000 | |
| Closed | Macero Diana J | $274,500 |
Source: Public Records
Tax History
| Year | Tax Paid | Tax Assessment Tax Assessment Total Assessment is a certain percentage of the fair market value that is determined by local assessors to be the total taxable value of land and additions on the property. | Land | Improvement |
|---|---|---|---|---|
| 2025 | $12,000 | $935,300 | $412,200 | $523,100 |
| 2024 | $11,615 | $878,600 | $396,500 | $482,100 |
| 2023 | $11,037 | $794,600 | $344,600 | $450,000 |
| 2022 | $10,322 | $713,800 | $319,200 | $394,600 |
| 2021 | $10,133 | $682,800 | $301,400 | $381,400 |
| 2020 | $9,735 | $649,400 | $284,100 | $365,300 |
| 2019 | $9,410 | $623,200 | $273,400 | $349,800 |
| 2018 | $9,211 | $603,200 | $263,000 | $340,200 |
| 2017 | $8,953 | $584,000 | $252,700 | $331,300 |
| 2016 | $8,724 | $560,700 | $245,200 | $315,500 |
| 2015 | $8,423 | $536,500 | $234,900 | $301,600 |
| 2014 | $8,012 | $508,400 | $234,900 | $273,500 |
Source: Public Records
Map
Nearby Homes
Your Personal Tour Guide
Ask me questions while you tour the home.