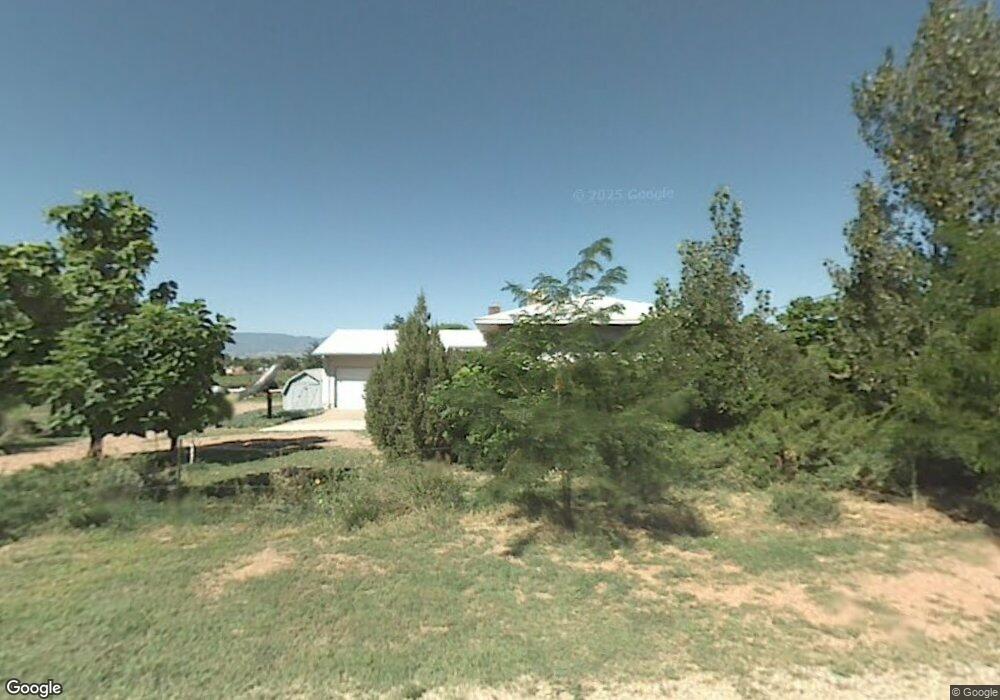
655 J St Penrose, CO 81240
Estimated Value: $445,397 - $575,000
4
Beds
3
Baths
2,620
Sq Ft
$202/Sq Ft
Est. Value
About This Home
This home is located at 655 J St, Penrose, CO 81240 and is currently estimated at $528,099, approximately $201 per square foot. 655 J St is a home located in Fremont County with nearby schools including Penrose Elementary School and Florence High School.
Ownership History
Date
Name
Owned For
Owner Type
Purchase Details
Closed on
May 23, 2018
Sold by
Jackson Andrew R
Bought by
Jackson Andrew R
Current Estimated Value
Home Financials for this Owner
Home Financials are based on the most recent Mortgage that was taken out on this home.
Original Mortgage
$306,450
Outstanding Balance
$263,864
Interest Rate
4.4%
Mortgage Type
VA
Estimated Equity
$264,235
Purchase Details
Closed on
Apr 30, 2014
Sold by
Monday Barry A and Monday Rachel R
Bought by
Jackson Andrew R
Home Financials for this Owner
Home Financials are based on the most recent Mortgage that was taken out on this home.
Original Mortgage
$224,852
Interest Rate
4.25%
Mortgage Type
FHA
Purchase Details
Closed on
Oct 12, 2011
Sold by
Harnes Ida J
Bought by
Monday Barry A and Monday Rachel R
Home Financials for this Owner
Home Financials are based on the most recent Mortgage that was taken out on this home.
Original Mortgage
$243,523
Interest Rate
4.28%
Mortgage Type
New Conventional
Create a Home Valuation Report for This Property
The Home Valuation Report is an in-depth analysis detailing your home's value as well as a comparison with similar homes in the area
Home Values in the Area
Average Home Value in this Area
Purchase History
| Date | Buyer | Sale Price | Title Company |
|---|---|---|---|
| Jackson Andrew R | -- | None Available | |
| Jackson Andrew R | $229,000 | Stewart Title | |
| Monday Barry A | $235,000 | Stewart Title |
Source: Public Records
Mortgage History
| Date | Status | Borrower | Loan Amount |
|---|---|---|---|
| Open | Jackson Andrew R | $306,450 | |
| Closed | Jackson Andrew R | $224,852 | |
| Previous Owner | Monday Barry A | $243,523 |
Source: Public Records
Tax History
| Year | Tax Paid | Tax Assessment Tax Assessment Total Assessment is a certain percentage of the fair market value that is determined by local assessors to be the total taxable value of land and additions on the property. | Land | Improvement |
|---|---|---|---|---|
| 2024 | $1,910 | $26,671 | $0 | $0 |
| 2023 | $1,693 | $22,986 | $0 | $0 |
| 2022 | $1,563 | $21,439 | $0 | $0 |
| 2021 | $1,583 | $22,056 | $0 | $0 |
| 2020 | $1,143 | $18,595 | $0 | $0 |
| 2019 | $1,148 | $18,595 | $0 | $0 |
| 2018 | $1,065 | $17,290 | $0 | $0 |
| 2017 | $1,067 | $17,290 | $0 | $0 |
| 2016 | $1,095 | $17,740 | $0 | $0 |
| 2015 | $1,081 | $17,740 | $0 | $0 |
| 2012 | $1,156 | $17,498 | $6,965 | $10,533 |
Source: Public Records
Map
Nearby Homes
- TBD J St
- 875 7th St
- 909 K St
- 730 6th St
- 358 Illinois St
- 708 Fremont St
- 15900 Vietnam Veterans Memorial Hwy
- 205 Illinois St
- 312 Fremont Ave
- 958 L St
- 15941 Vietnam Veterans Memorial Hwy
- 207 Fremont St
- TBD 11th St
- 000 11th St
- 215 Sherrill Dr
- TBD County Road 123
- 1183 2nd St
- 33 7th Ave
- 12 Grant St
- 1115 M St
Your Personal Tour Guide
Ask me questions while you tour the home.