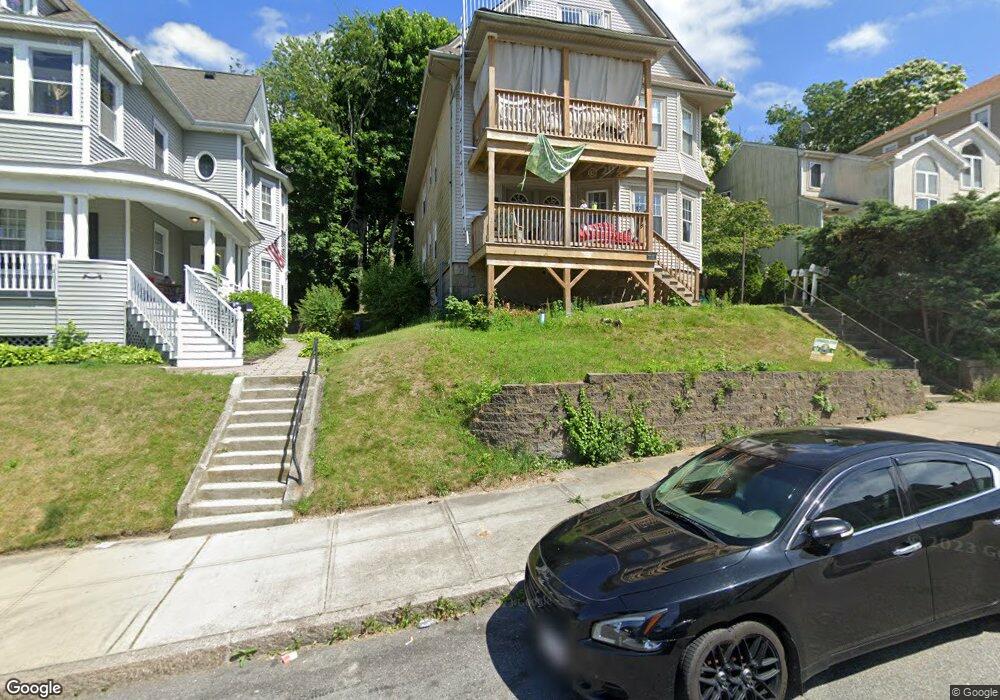
655 June St Unit 657 Fall River, MA 02720
Lower Highlands NeighborhoodEstimated Value: $587,000 - $702,000
6
Beds
3
Baths
3,291
Sq Ft
$201/Sq Ft
Est. Value
About This Home
This home is located at 655 June St Unit 657, Fall River, MA 02720 and is currently estimated at $661,333, approximately $200 per square foot. 655 June St Unit 657 is a home located in Bristol County with nearby schools including Mary Fonseca Elementary School, Morton Middle School, and B M C Durfee High School.
Ownership History
Date
Name
Owned For
Owner Type
Purchase Details
Closed on
Nov 12, 2014
Sold by
Sherman Christie A
Bought by
Hsbc Bank Usa Na Tr
Current Estimated Value
Purchase Details
Closed on
Jul 31, 2003
Sold by
Michael J Mcnally T
Bought by
Sherman Christie A
Home Financials for this Owner
Home Financials are based on the most recent Mortgage that was taken out on this home.
Original Mortgage
$284,050
Interest Rate
5.28%
Mortgage Type
Purchase Money Mortgage
Create a Home Valuation Report for This Property
The Home Valuation Report is an in-depth analysis detailing your home's value as well as a comparison with similar homes in the area
Home Values in the Area
Average Home Value in this Area
Purchase History
| Date | Buyer | Sale Price | Title Company |
|---|---|---|---|
| Hsbc Bank Usa Na Tr | $346,217 | -- | |
| Sherman Christie A | $299,000 | -- |
Source: Public Records
Mortgage History
| Date | Status | Borrower | Loan Amount |
|---|---|---|---|
| Previous Owner | Sherman Christie A | $284,050 | |
| Previous Owner | Sherman Christie A | $25,000 | |
| Previous Owner | Sherman Christie A | $95,000 |
Source: Public Records
Tax History
| Year | Tax Paid | Tax Assessment Tax Assessment Total Assessment is a certain percentage of the fair market value that is determined by local assessors to be the total taxable value of land and additions on the property. | Land | Improvement |
|---|---|---|---|---|
| 2025 | $6,138 | $536,100 | $138,100 | $398,000 |
| 2024 | $5,876 | $511,400 | $132,800 | $378,600 |
| 2023 | $5,229 | $426,200 | $114,800 | $311,400 |
| 2022 | $4,652 | $368,600 | $107,400 | $261,200 |
| 2021 | $4,500 | $325,400 | $107,700 | $217,700 |
| 2020 | $4,124 | $285,400 | $107,900 | $177,500 |
| 2019 | $3,655 | $250,700 | $109,600 | $141,100 |
| 2018 | $3,284 | $224,600 | $109,600 | $115,000 |
| 2017 | $3,018 | $215,600 | $100,600 | $115,000 |
| 2016 | $2,899 | $212,700 | $100,600 | $112,100 |
| 2015 | $2,782 | $212,700 | $100,600 | $112,100 |
| 2014 | -- | $216,700 | $93,800 | $122,900 |
Source: Public Records
Map
Nearby Homes
- 11 Dyer St
- 909 High St Unit 1
- 889 High St
- 267 Lincoln Ave
- 327 Brownell St
- 33-35 Malvey St
- 10 N Court St Unit 3
- 72 Belmont St
- 750 Davol St Unit 1012
- 750 Davol St Unit 219
- 750 Davol St Unit 221
- 750 Davol St Unit 616
- 750 Davol St Unit 214
- 503 Highland Ave
- 575 N Main St
- 302 Cory St
- 376 N Underwood St
- 499 Hanover St
- 213 Weetamoe St
- 450 Rock St Unit 1
Your Personal Tour Guide
Ask me questions while you tour the home.