655 Main St Sturbridge, MA 01518
Estimated Value: $290,000 - $363,000
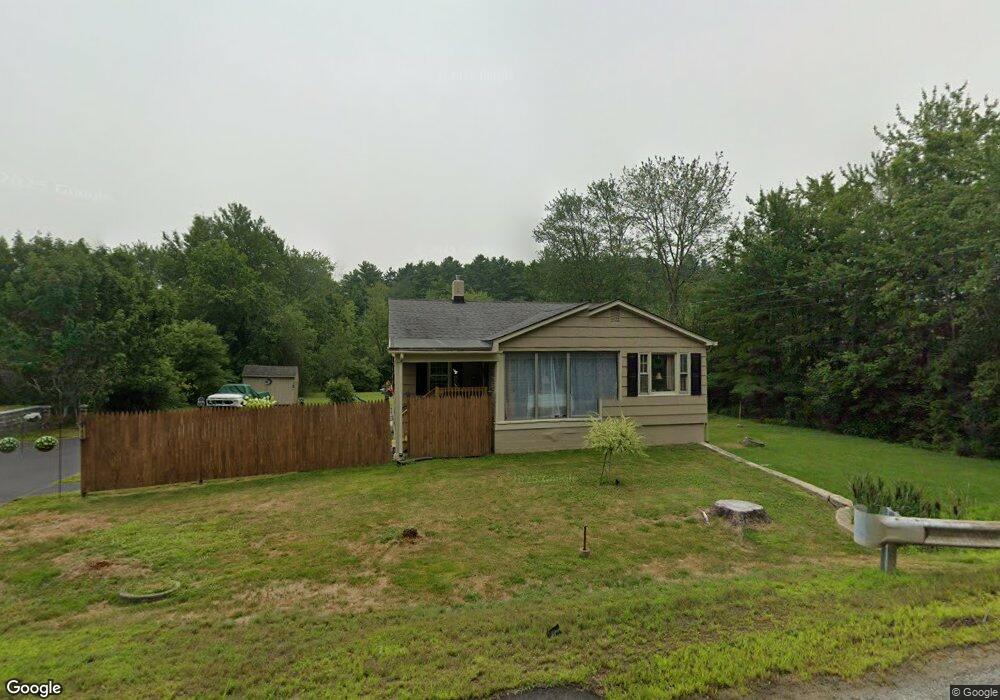
About This Home
This home is located at 655 Main St, Sturbridge, MA 01518 and is currently estimated at $338,000, approximately $384 per square foot. 655 Main St is a home located in Worcester County with nearby schools including Burgess Elementary School, Tantasqua Regional Junior High School, and Tantasqua Regional High School.
Ownership History
We collect this data history from publicly available records. To have your information removed, we recommend requesting removal directly through your county’s website.
Purchase Details
Home Financials for this Owner
Home Financials are based on the most recent Mortgage that was taken out on this home.Home Values in the Area
Average Home Value in this Area
Purchase History
We collect this data history from publicly available records. To have your information removed, we recommend requesting removal directly through your county’s website.
| Date | Buyer | Sale Price | Title Company |
|---|---|---|---|
| $62,784 | -- | ||
| $62,784 | -- |
Mortgage History
We collect this data history from publicly available records. To have your information removed, we recommend requesting removal directly through your county’s website.
| Date | Status | Borrower | Loan Amount |
|---|---|---|---|
| Open | $50,000 | ||
| Open | $700,000 | ||
| Closed | $50,000 | ||
| Closed | $647,115 |
Tax History
We collect this data history from publicly available records. To have your information removed, we recommend requesting removal directly through your county’s website.
| Year | Tax Paid | Tax Assessment Tax Assessment Total Assessment is a certain percentage of the fair market value that is determined by local assessors to be the total taxable value of land and additions on the property. | Land | Improvement |
|---|---|---|---|---|
| 2025 | $4,276 | $268,400 | $74,500 | $193,900 |
| 2024 | $3,906 | $236,900 | $73,100 | $163,800 |
| 2023 | $3,690 | $204,200 | $63,900 | $140,300 |
| 2022 | $3,543 | $185,000 | $57,900 | $127,100 |
| 2021 | $3,127 | $164,400 | $55,200 | $109,200 |
| 2020 | $3,127 | $164,400 | $55,200 | $109,200 |
| 2019 | $3,054 | $159,500 | $56,900 | $102,600 |
| 2018 | $2,967 | $152,600 | $54,200 | $98,400 |
| 2017 | $2,825 | $145,600 | $52,100 | $93,500 |
| 2016 | $2,805 | $146,000 | $50,500 | $95,500 |
| 2015 | $2,751 | $143,000 | $50,500 | $92,500 |
Map
- 16 Summit Ave
- 621 Main St
- 7 Crescent Way Unit 302
- 7 Crescent Way Unit 315
- 7 Crescent Way Unit 307
- 9 Cricket Dr
- 26 Cedar Lake Dr
- 299 Clark Road Extension
- 368 Main St
- 365 Main St Unit 3
- 266 Holland Rd
- 25 Sturbridge Hills Rd Unit 25
- 174 Cedar St
- 66 Steeple View Unit 66
- 79 7th St
- 9 Haynes St
- 121 & lt12 Sturbridge Rd
- 10 Maple St
- 14 Maple St
- Lot B-6 River Rd
Ask me questions while you tour the home.