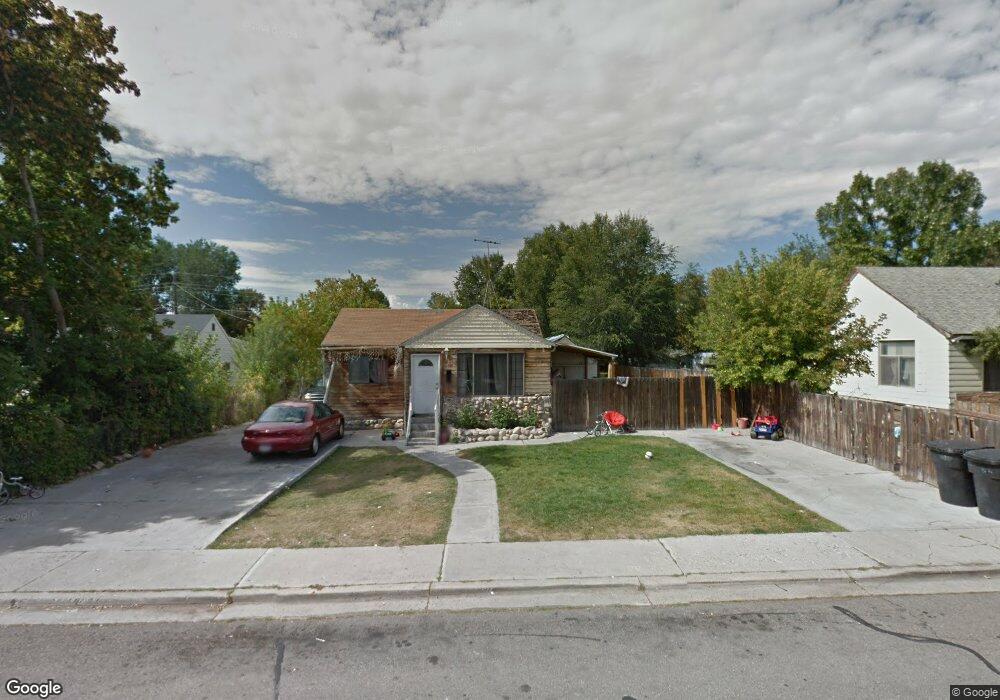
655 N 970 W Provo, UT 84601
Rivergrove NeighborhoodEstimated Value: $454,000 - $492,423
4
Beds
2
Baths
1,440
Sq Ft
$330/Sq Ft
Est. Value
About This Home
This home is located at 655 N 970 W, Provo, UT 84601 and is currently estimated at $475,141, approximately $329 per square foot. 655 N 970 W is a home located in Utah County with nearby schools including Timpanogos Elementary School, Dixon Middle School, and Provo High School.
Ownership History
Date
Name
Owned For
Owner Type
Purchase Details
Closed on
Mar 12, 2024
Sold by
Madrigal Francisco and Madrigal Jesus
Bought by
Aguay Mendoza Maria Estela
Current Estimated Value
Purchase Details
Closed on
Jul 31, 1998
Sold by
Egmont Resources Institute
Bought by
Madrigal Francisco and Madrigal Jesus
Home Financials for this Owner
Home Financials are based on the most recent Mortgage that was taken out on this home.
Original Mortgage
$108,436
Interest Rate
6.9%
Mortgage Type
FHA
Create a Home Valuation Report for This Property
The Home Valuation Report is an in-depth analysis detailing your home's value as well as a comparison with similar homes in the area
Home Values in the Area
Average Home Value in this Area
Purchase History
| Date | Buyer | Sale Price | Title Company |
|---|---|---|---|
| Aguay Mendoza Maria Estela | -- | None Listed On Document | |
| Madrigal Francisco | -- | -- | |
| Egmont Resources Institute | -- | -- |
Source: Public Records
Mortgage History
| Date | Status | Borrower | Loan Amount |
|---|---|---|---|
| Previous Owner | Madrigal Francisco | $108,436 |
Source: Public Records
Tax History
| Year | Tax Paid | Tax Assessment Tax Assessment Total Assessment is a certain percentage of the fair market value that is determined by local assessors to be the total taxable value of land and additions on the property. | Land | Improvement |
|---|---|---|---|---|
| 2025 | $2,356 | $254,925 | -- | -- |
| 2024 | $2,356 | $231,935 | $0 | $0 |
| 2023 | $2,345 | $227,590 | $0 | $0 |
| 2022 | $2,514 | $245,960 | $0 | $0 |
| 2021 | $1,809 | $308,700 | $136,100 | $172,600 |
| 2020 | $1,754 | $280,600 | $123,700 | $156,900 |
| 2019 | $1,593 | $265,100 | $108,200 | $156,900 |
| 2018 | $1,434 | $242,000 | $104,300 | $137,700 |
| 2017 | $1,292 | $119,790 | $0 | $0 |
| 2016 | $1,177 | $101,695 | $0 | $0 |
| 2015 | $1,125 | $98,230 | $0 | $0 |
| 2014 | $986 | $89,760 | $0 | $0 |
Source: Public Records
Map
Nearby Homes
Your Personal Tour Guide
Ask me questions while you tour the home.