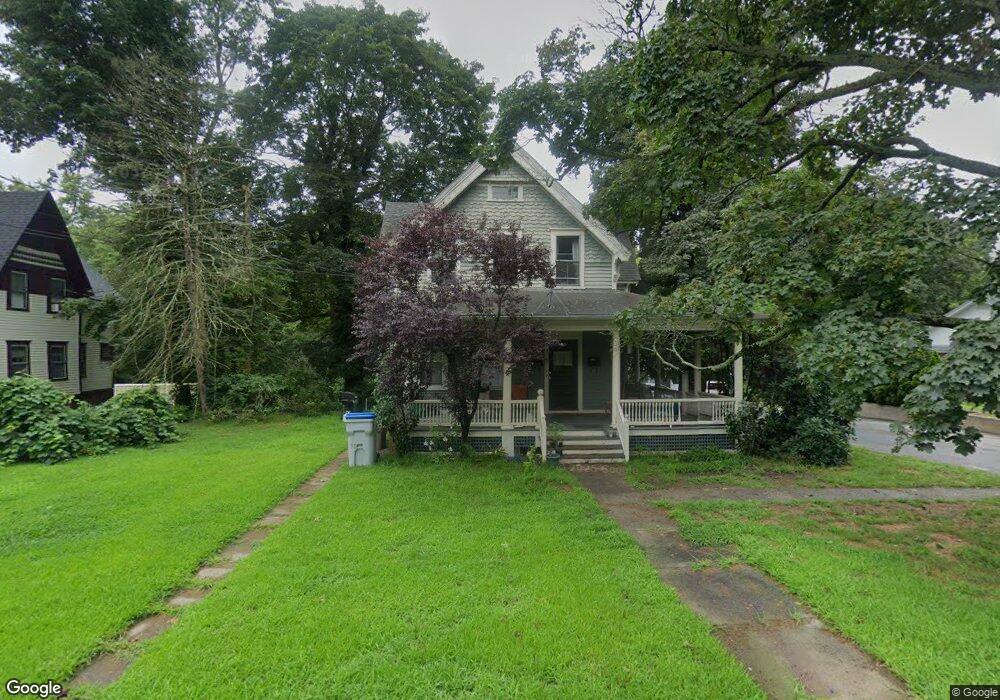
655 N Main St Danielson, CT 06239
Estimated Value: $217,000 - $311,000
4
Beds
2
Baths
2,241
Sq Ft
$123/Sq Ft
Est. Value
About This Home
This home is located at 655 N Main St, Danielson, CT 06239 and is currently estimated at $276,055, approximately $123 per square foot. 655 N Main St is a home located in Windham County with nearby schools including Killingly Central School, Killingly Memorial School, and Killingly Intermediate School.
Ownership History
Date
Name
Owned For
Owner Type
Purchase Details
Closed on
Sep 16, 2008
Sold by
Robert Stone Llc
Bought by
Devries Tr Randall A
Current Estimated Value
Home Financials for this Owner
Home Financials are based on the most recent Mortgage that was taken out on this home.
Original Mortgage
$80,000
Interest Rate
6.58%
Purchase Details
Closed on
Aug 26, 2005
Sold by
Department Of Housing & Urban Dev
Bought by
Darigan Kimberly
Purchase Details
Closed on
Aug 5, 2002
Sold by
Bonneau Richard A and Bonneau Charlene
Bought by
Chase David J
Purchase Details
Closed on
May 1, 2001
Sold by
Bell Christopher and Rosenberg Paula
Bought by
Bonneau Richard A and Bonneau Charlene
Create a Home Valuation Report for This Property
The Home Valuation Report is an in-depth analysis detailing your home's value as well as a comparison with similar homes in the area
Home Values in the Area
Average Home Value in this Area
Purchase History
| Date | Buyer | Sale Price | Title Company |
|---|---|---|---|
| Devries Tr Randall A | $120,000 | -- | |
| Devries Tr Randall A | $120,000 | -- | |
| Darigan Kimberly | $166,027 | -- | |
| Darigan Kimberly | $166,027 | -- | |
| Chase David J | $130,000 | -- | |
| Bonneau Richard A | $70,000 | -- | |
| Bonneau Richard A | $70,000 | -- |
Source: Public Records
Mortgage History
| Date | Status | Borrower | Loan Amount |
|---|---|---|---|
| Closed | Bonneau Richard A | $80,000 |
Source: Public Records
Tax History
| Year | Tax Paid | Tax Assessment Tax Assessment Total Assessment is a certain percentage of the fair market value that is determined by local assessors to be the total taxable value of land and additions on the property. | Land | Improvement |
|---|---|---|---|---|
| 2025 | $4,204 | $179,270 | $27,520 | $151,750 |
| 2024 | $3,956 | $179,270 | $27,520 | $151,750 |
| 2023 | $2,980 | $104,020 | $22,680 | $81,340 |
| 2022 | $2,799 | $104,020 | $22,680 | $81,340 |
| 2021 | $2,799 | $104,020 | $22,680 | $81,340 |
| 2020 | $2,740 | $104,020 | $22,680 | $81,340 |
| 2019 | $2,794 | $104,020 | $22,680 | $81,340 |
| 2017 | $2,317 | $79,310 | $14,560 | $64,750 |
| 2016 | $2,309 | $79,310 | $14,560 | $64,750 |
| 2015 | $2,325 | $79,310 | $14,560 | $64,750 |
| 2014 | $2,261 | $79,310 | $14,560 | $64,750 |
Source: Public Records
Map
Nearby Homes
- 48 Athol St Unit 48
- 74 Athol St
- 29 Rosedale St
- 144 Prospect Ave
- 73 Hawkins St
- 10 Center St
- 24 Center St
- 133 Maple St
- 102 Cottage St
- 85 Mashentuck Rd
- 61 Deerwood Dr
- 37 Ruth St
- 85 Furnace St
- 106 Water St
- 135 Adelaide St
- 37 Katherine Ave
- 56 Deerwood Dr
- 724 Cook Hill Rd
- 175 Mashentuck Rd
- 14 Valley View Dr
Your Personal Tour Guide
Ask me questions while you tour the home.