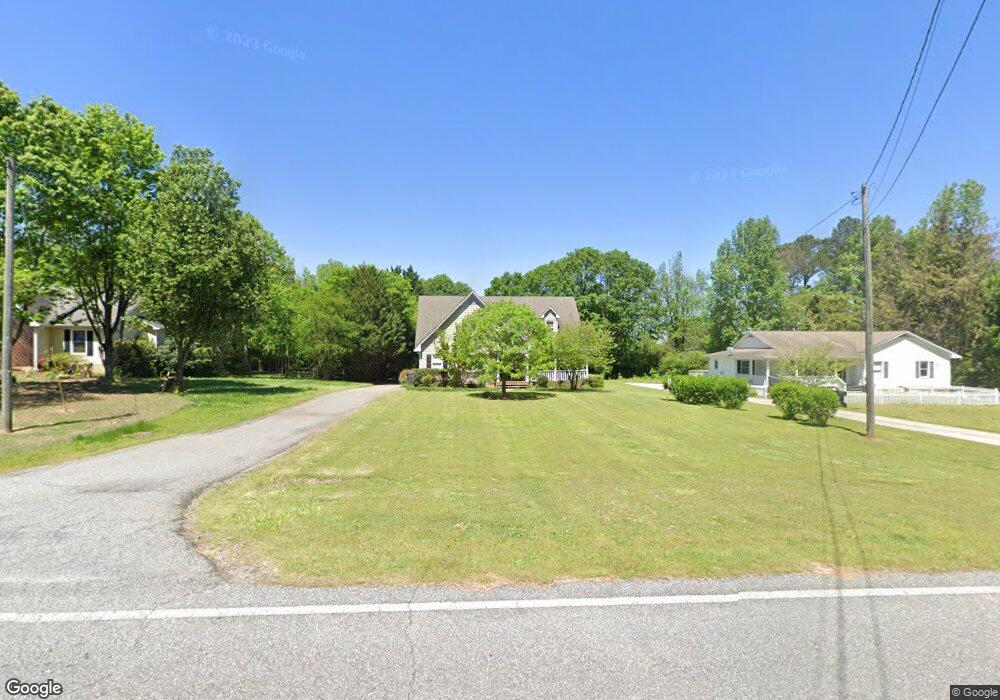
655 Old Lexington Rd Crawford, GA 30630
Estimated Value: $245,000 - $299,000
3
Beds
3
Baths
2,058
Sq Ft
$136/Sq Ft
Est. Value
About This Home
This home is located at 655 Old Lexington Rd, Crawford, GA 30630 and is currently estimated at $280,673, approximately $136 per square foot. 655 Old Lexington Rd is a home located in Oglethorpe County with nearby schools including Oglethorpe County Primary School, Oglethorpe County Elementary School, and Oglethorpe County Middle School.
Ownership History
Date
Name
Owned For
Owner Type
Purchase Details
Closed on
Mar 18, 2011
Sold by
Beneficial Mortgage Co Of Georgia
Bought by
Faust Robert D and Faust Amanda J
Current Estimated Value
Home Financials for this Owner
Home Financials are based on the most recent Mortgage that was taken out on this home.
Original Mortgage
$82,845
Outstanding Balance
$56,815
Interest Rate
4.75%
Mortgage Type
FHA
Estimated Equity
$223,858
Purchase Details
Closed on
Nov 2, 2010
Sold by
Beasley Tracy
Bought by
Beneficial Mortgage Co Of Georgia
Purchase Details
Closed on
Oct 2, 2003
Sold by
Beasley Tracy and Beasley Forr
Bought by
Beasley Tracy
Purchase Details
Closed on
Oct 15, 1999
Sold by
Brown Dwight
Bought by
Beasley Tracy and Beasley Forr
Purchase Details
Closed on
Aug 4, 1998
Sold by
Moore Elizabeth Faus
Bought by
Brown Dwight
Create a Home Valuation Report for This Property
The Home Valuation Report is an in-depth analysis detailing your home's value as well as a comparison with similar homes in the area
Home Values in the Area
Average Home Value in this Area
Purchase History
| Date | Buyer | Sale Price | Title Company |
|---|---|---|---|
| Faust Robert D | $85,000 | -- | |
| Beneficial Mortgage Co Of Georgia | $123,201 | -- | |
| Beasley Tracy | -- | -- | |
| Beasley Tracy | $125,000 | -- | |
| Brown Dwight | $5,800 | -- |
Source: Public Records
Mortgage History
| Date | Status | Borrower | Loan Amount |
|---|---|---|---|
| Open | Faust Robert D | $82,845 |
Source: Public Records
Tax History Compared to Growth
Tax History
| Year | Tax Paid | Tax Assessment Tax Assessment Total Assessment is a certain percentage of the fair market value that is determined by local assessors to be the total taxable value of land and additions on the property. | Land | Improvement |
|---|---|---|---|---|
| 2024 | $2,782 | $101,960 | $3,000 | $98,960 |
| 2023 | $2,990 | $101,960 | $3,000 | $98,960 |
| 2022 | $2,103 | $81,800 | $3,000 | $78,800 |
| 2021 | $1,696 | $58,760 | $2,240 | $56,520 |
| 2020 | $1,353 | $58,760 | $2,240 | $56,520 |
| 2019 | $1,485 | $58,760 | $2,240 | $56,520 |
| 2018 | $1,721 | $48,518 | $807 | $47,711 |
| 2017 | $1,551 | $48,518 | $807 | $47,711 |
| 2016 | $1,518 | $48,518 | $807 | $47,711 |
| 2015 | -- | $48,992 | $807 | $48,185 |
| 2014 | -- | $48,992 | $807 | $48,185 |
| 2013 | -- | $48,992 | $807 | $48,184 |
Source: Public Records
Map
Nearby Homes
- 667 Old Lexington Rd
- 643 Old Lexington Rd
- 679 Old Lexington Rd
- 637 Old Lexington Rd
- 1025 Athens Rd
- 668 Old Lexington Rd
- 1017 Athens Rd
- 1031 Athens Rd
- 644 Old Lexington Rd
- 633 Old Lexington Rd
- 695 Old Lexington Rd
- 1035 Athens Rd
- 1001 Athens Rd
- 1041 Athens Rd
- 617 Old Lexington Rd
- 218 Lakeview Dr
- 1030 Athens Rd
- 614 Old Lexington Rd
- 1038 Athens Rd
- 1049 Athens Rd