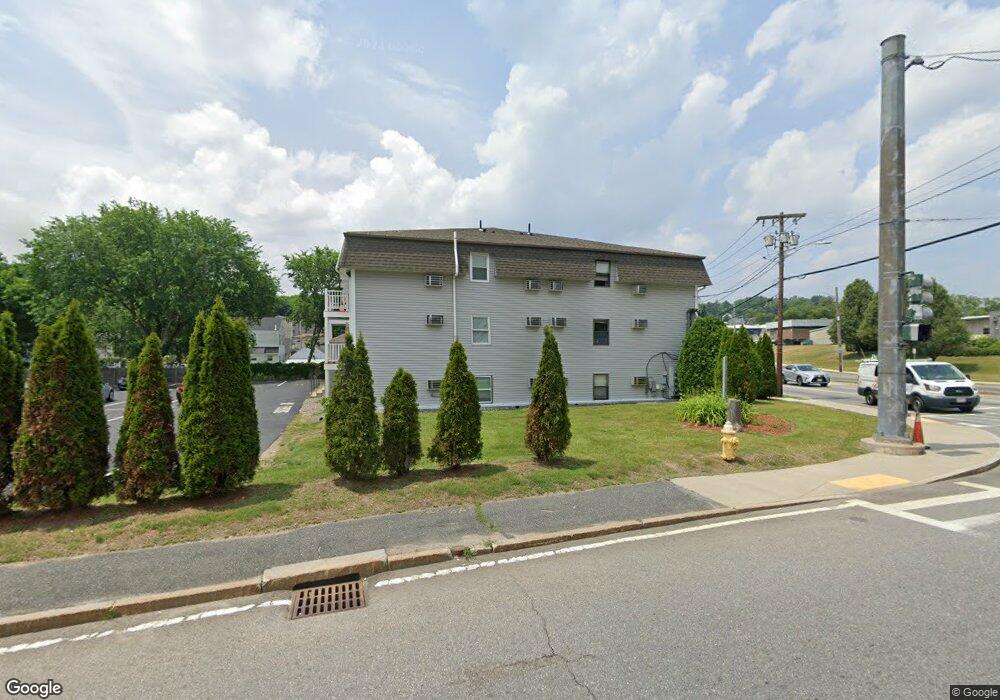
655 Plantation St Unit 10 Worcester, MA 01605
Estimated Value: $256,000 - $286,000
2
Beds
1
Bath
962
Sq Ft
$279/Sq Ft
Est. Value
About This Home
This home is located at 655 Plantation St Unit 10, Worcester, MA 01605 and is currently estimated at $268,486, approximately $279 per square foot. 655 Plantation St Unit 10 is a home located in Worcester County with nearby schools including Jacob Hiatt Magnet School, Chandler Magnet, and Lincoln Street School.
Ownership History
Date
Name
Owned For
Owner Type
Purchase Details
Closed on
May 13, 2022
Sold by
Brito-Chaves Doricarla and Chaves Doricarla
Bought by
Mcdonald Patricia
Current Estimated Value
Purchase Details
Closed on
Dec 1, 2020
Sold by
Li Shu
Bought by
Chaves Doricarla B
Home Financials for this Owner
Home Financials are based on the most recent Mortgage that was taken out on this home.
Original Mortgage
$97,500
Interest Rate
2.8%
Mortgage Type
New Conventional
Purchase Details
Closed on
Nov 16, 2018
Sold by
Brito Patricio A and Brito Ruth M
Bought by
Li Shu
Purchase Details
Closed on
Jul 10, 2001
Sold by
Mehta P C and Mehta Arti P
Bought by
Brito Patriciao A and Brito Ruth M
Home Financials for this Owner
Home Financials are based on the most recent Mortgage that was taken out on this home.
Original Mortgage
$75,240
Interest Rate
7.21%
Mortgage Type
Purchase Money Mortgage
Purchase Details
Closed on
Mar 31, 1998
Sold by
Frank Vanummersen Ii T and Vanummersen Lynn
Bought by
Mehta Pradip C and Mehta Arti P
Create a Home Valuation Report for This Property
The Home Valuation Report is an in-depth analysis detailing your home's value as well as a comparison with similar homes in the area
Home Values in the Area
Average Home Value in this Area
Purchase History
| Date | Buyer | Sale Price | Title Company |
|---|---|---|---|
| Mcdonald Patricia | $205,000 | None Available | |
| Chaves Doricarla B | $130,000 | None Available | |
| Li Shu | $114,500 | -- | |
| Brito Patriciao A | $77,000 | -- | |
| Mehta Pradip C | $31,050 | -- |
Source: Public Records
Mortgage History
| Date | Status | Borrower | Loan Amount |
|---|---|---|---|
| Previous Owner | Chaves Doricarla B | $97,500 | |
| Previous Owner | Mehta Pradip C | $75,240 |
Source: Public Records
Tax History Compared to Growth
Tax History
| Year | Tax Paid | Tax Assessment Tax Assessment Total Assessment is a certain percentage of the fair market value that is determined by local assessors to be the total taxable value of land and additions on the property. | Land | Improvement |
|---|---|---|---|---|
| 2025 | $2,689 | $203,900 | $0 | $203,900 |
| 2024 | $2,635 | $191,600 | $0 | $191,600 |
| 2023 | $2,347 | $163,700 | $0 | $163,700 |
| 2022 | $2,066 | $135,800 | $0 | $135,800 |
| 2021 | $2,037 | $125,100 | $0 | $125,100 |
| 2020 | $1,972 | $116,000 | $0 | $116,000 |
| 2019 | $1,453 | $80,700 | $0 | $80,700 |
| 2018 | $1,424 | $75,300 | $0 | $75,300 |
| 2017 | $1,442 | $75,000 | $0 | $75,000 |
| 2016 | $2,133 | $103,500 | $0 | $103,500 |
| 2015 | $2,077 | $103,500 | $0 | $103,500 |
| 2014 | $2,022 | $103,500 | $0 | $103,500 |
Source: Public Records
Map
Nearby Homes
- 57 Pasadena Pkwy
- 3 Huron Ave
- 22 Huron Ave
- 15 Wayside Rd
- 25 White Ave
- 5A Wigwam Hill Dr Unit A
- 91-93 Natural History Dr
- 56 Wigwam Hill Dr
- 64 Wauwinet Rd
- 2206 Halcyon Dr Unit 2206
- 304 Saint Nicholas Ave
- 45 Goldthwaite Rd
- 163 N Lake Ave
- 45 Ireta Rd
- 8 Cherry Blossom Cir Unit 50
- 9 Green Hill Ave
- 23 Viele Ave
- 276 Saint Nicholas Ave
- 29 Dominion Rd
- 15 Eaglehead Terrace Unit 5
- 655 Plantation St Unit 18 B
- 655 Plantation St Unit 22B
- 655 Plantation St Unit 20B
- 655 Plantation St Unit 12
- 655 Plantation St Unit 11
- 655 Plantation St Unit 9
- 655 Plantation St Unit 8
- 655 Plantation St Unit 7
- 655 Plantation St Unit 6
- 655 Plantation St Unit 5
- 655 Plantation St Unit 4
- 655 Plantation St Unit 3
- 655 Plantation St Unit 2
- 655 Plantation St Unit 1
- 655 Plantation St Unit 24B 655
- 655 Plantation St Unit 17B,655
- 655 Plantation St Unit 24B
- 655 Plantation St Unit 21B
- 655 Plantation St Unit 16B
- 655 Plantation St Unit 15B