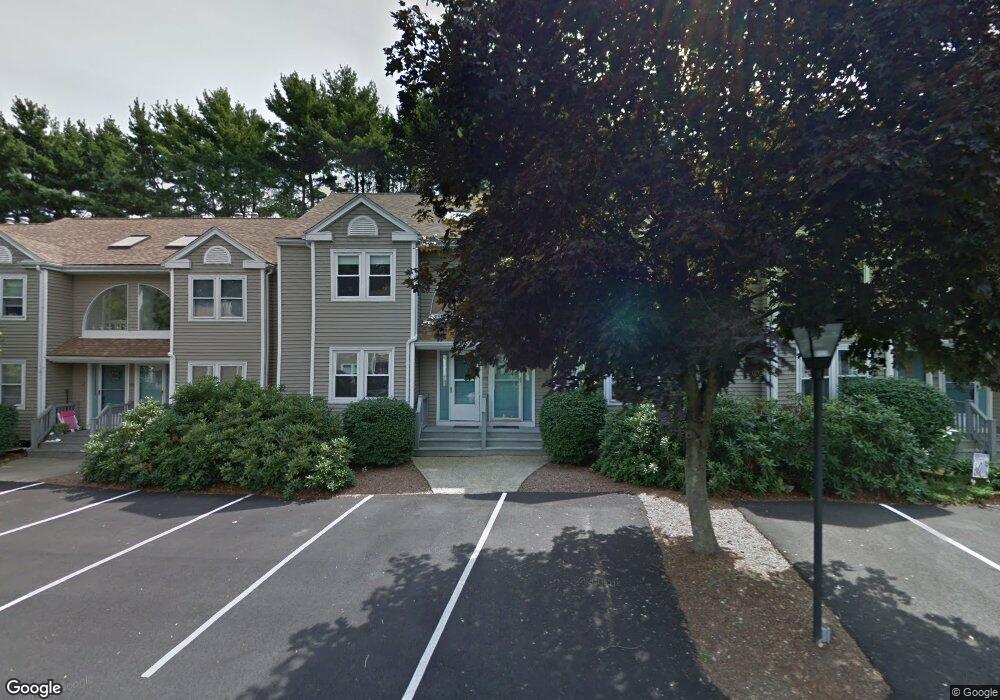
655 Pleasant St Unit 1 East Weymouth, MA 02189
East Weymouth NeighborhoodEstimated Value: $346,000 - $493,000
2
Beds
2
Baths
1,914
Sq Ft
$229/Sq Ft
Est. Value
About This Home
This home is located at 655 Pleasant St Unit 1, East Weymouth, MA 02189 and is currently estimated at $438,793, approximately $229 per square foot. 655 Pleasant St Unit 1 is a home located in Norfolk County with nearby schools including Ralph Talbot Primary School, Abigail Adams Middle School, and Weymouth Middle School Chapman.
Ownership History
Date
Name
Owned For
Owner Type
Purchase Details
Closed on
Apr 8, 2019
Sold by
Phan Dung
Bought by
Geary Marykate J
Current Estimated Value
Home Financials for this Owner
Home Financials are based on the most recent Mortgage that was taken out on this home.
Original Mortgage
$208,050
Outstanding Balance
$182,913
Interest Rate
4.3%
Mortgage Type
New Conventional
Estimated Equity
$255,880
Purchase Details
Closed on
Jul 19, 2012
Sold by
Betts George R
Bought by
George R Betts Irt and Betts George R
Purchase Details
Closed on
Jul 30, 2010
Sold by
Dethomaso Domenic J and Dethomaso Dianne M
Bought by
Betts George R
Purchase Details
Closed on
Sep 3, 2002
Sold by
Levinson Mark J
Bought by
Dethomaso Dominic J and Dethomaso Dianne M
Home Financials for this Owner
Home Financials are based on the most recent Mortgage that was taken out on this home.
Original Mortgage
$176,000
Interest Rate
6.55%
Mortgage Type
Purchase Money Mortgage
Create a Home Valuation Report for This Property
The Home Valuation Report is an in-depth analysis detailing your home's value as well as a comparison with similar homes in the area
Home Values in the Area
Average Home Value in this Area
Purchase History
| Date | Buyer | Sale Price | Title Company |
|---|---|---|---|
| Geary Marykate J | $219,000 | -- | |
| George R Betts Irt | -- | -- | |
| Betts George R | $260,000 | -- | |
| Dethomaso Dominic J | $220,000 | -- |
Source: Public Records
Mortgage History
| Date | Status | Borrower | Loan Amount |
|---|---|---|---|
| Open | Geary Marykate J | $208,050 | |
| Previous Owner | Dethomaso Dominic J | $176,000 |
Source: Public Records
Tax History Compared to Growth
Tax History
| Year | Tax Paid | Tax Assessment Tax Assessment Total Assessment is a certain percentage of the fair market value that is determined by local assessors to be the total taxable value of land and additions on the property. | Land | Improvement |
|---|---|---|---|---|
| 2025 | $3,993 | $395,300 | $0 | $395,300 |
| 2024 | $4,073 | $396,600 | $0 | $396,600 |
| 2023 | $3,857 | $369,100 | $0 | $369,100 |
| 2022 | $3,957 | $345,300 | $0 | $345,300 |
| 2021 | $3,758 | $320,100 | $0 | $320,100 |
| 2020 | $3,602 | $302,200 | $0 | $302,200 |
| 2019 | $3,379 | $278,800 | $0 | $278,800 |
| 2018 | $3,111 | $248,900 | $0 | $248,900 |
| 2017 | $3,012 | $235,100 | $0 | $235,100 |
| 2016 | $2,879 | $224,900 | $0 | $224,900 |
| 2015 | $2,740 | $212,400 | $0 | $212,400 |
| 2014 | $2,574 | $193,500 | $0 | $193,500 |
Source: Public Records
Map
Nearby Homes
- 675 Pleasant St Unit 8
- 131 Mutton Ln
- 1015 Washington St
- 191 Tall Oaks Dr Unit C
- 14 Old Stone Way Unit 11
- 10 Chapman St Unit 205
- 10 Chapman St Unit 202
- 955 Pleasant St Unit 11
- 200 Burkhall St Unit 803
- 200 Burkhall St Unit 102
- 966 Washington St Unit 2
- 110 Burkhall St Unit H
- 16 Oak Cliff Rd
- 279 Pine St
- 25 Echo Ave
- 120 Burkhall St Unit K
- 376 Pleasant St
- 86 Black Rock Dr
- 747 Middle St
- 2 Tara Dr Unit 1
- 655 Pleasant St Unit 8
- 655 Pleasant St Unit 7
- 655 Pleasant St Unit 5
- 655 Pleasant St Unit 4
- 655 Pleasant St Unit 3
- 655 Pleasant St Unit 2
- 653 Pleasant St
- 665 Pleasant St Unit 5
- 665 Pleasant St Unit 4
- 665 Pleasant St Unit 3
- 665 Pleasant St Unit 2
- 665 Pleasant St Unit 1
- 671 Pleasant St Unit 6
- 671 Pleasant St Unit 5
- 671 Pleasant St Unit 4
- 671 Pleasant St Unit 3
- 671 Pleasant St Unit 2
- 671 Pleasant St Unit 1
- 661 Pleasant St Unit 4
- 661 Pleasant St Unit 3