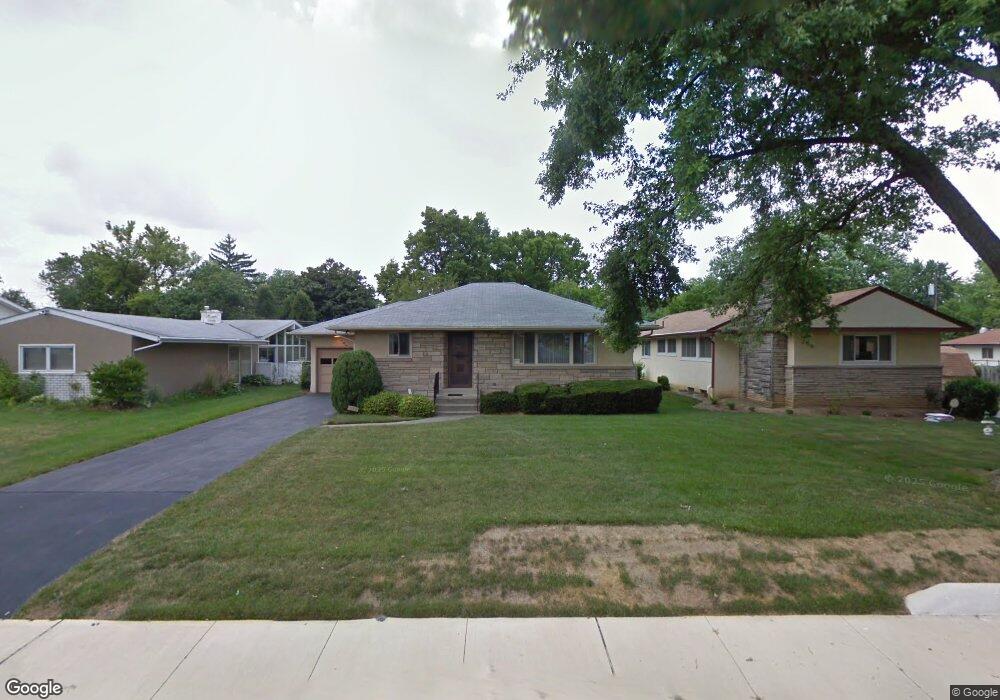
655 S Kellner Rd Columbus, OH 43209
Eastmoor NeighborhoodEstimated Value: $270,000 - $308,000
2
Beds
2
Baths
1,205
Sq Ft
$239/Sq Ft
Est. Value
About This Home
This home is located at 655 S Kellner Rd, Columbus, OH 43209 and is currently estimated at $287,688, approximately $238 per square foot. 655 S Kellner Rd is a home located in Franklin County with nearby schools including Fairmoor Elementary School, Johnson Park Middle School, and Walnut Ridge High School.
Ownership History
Date
Name
Owned For
Owner Type
Purchase Details
Closed on
Aug 21, 2018
Sold by
Levitin Alice
Bought by
Levitin Alice and Levitin Ben
Current Estimated Value
Home Financials for this Owner
Home Financials are based on the most recent Mortgage that was taken out on this home.
Original Mortgage
$7,100
Outstanding Balance
$6,115
Interest Rate
4.6%
Mortgage Type
Commercial
Estimated Equity
$281,573
Purchase Details
Closed on
Jun 26, 2018
Sold by
Levitin Alice
Bought by
Levitin Alice and Levitin Ben
Home Financials for this Owner
Home Financials are based on the most recent Mortgage that was taken out on this home.
Original Mortgage
$7,100
Outstanding Balance
$6,115
Interest Rate
4.6%
Mortgage Type
Commercial
Estimated Equity
$281,573
Purchase Details
Closed on
Aug 9, 2007
Sold by
Fleischmann Paul
Bought by
Levitin Alice and Mentser Sandra
Purchase Details
Closed on
Oct 6, 1986
Bought by
Fleischmann Paul
Create a Home Valuation Report for This Property
The Home Valuation Report is an in-depth analysis detailing your home's value as well as a comparison with similar homes in the area
Home Values in the Area
Average Home Value in this Area
Purchase History
| Date | Buyer | Sale Price | Title Company |
|---|---|---|---|
| Levitin Alice | -- | Bexley Title Box | |
| Levitin Alice | -- | Bexley Title Ins Agcy Inc | |
| Lewis Katie | -- | Baxley Title Ins Agcy Inc | |
| Levitin Alice | -- | Attorney | |
| Fleischmann Paul | $68,500 | -- |
Source: Public Records
Mortgage History
| Date | Status | Borrower | Loan Amount |
|---|---|---|---|
| Open | Lewis Katie | $7,100 |
Source: Public Records
Tax History
| Year | Tax Paid | Tax Assessment Tax Assessment Total Assessment is a certain percentage of the fair market value that is determined by local assessors to be the total taxable value of land and additions on the property. | Land | Improvement |
|---|---|---|---|---|
| 2025 | $4,419 | $98,460 | $42,770 | $55,690 |
| 2024 | $4,419 | $98,460 | $42,770 | $55,690 |
| 2023 | $4,362 | $98,455 | $42,770 | $55,685 |
| 2022 | $3,404 | $65,630 | $27,650 | $37,980 |
| 2021 | $3,410 | $65,630 | $27,650 | $37,980 |
| 2020 | $3,414 | $65,630 | $27,650 | $37,980 |
| 2019 | $3,096 | $51,030 | $22,120 | $28,910 |
| 2018 | $2,754 | $51,030 | $22,120 | $28,910 |
| 2017 | $3,172 | $51,030 | $22,120 | $28,910 |
| 2016 | $2,656 | $39,100 | $15,120 | $23,980 |
| 2015 | $2,418 | $39,100 | $15,120 | $23,980 |
| 2014 | $2,424 | $39,100 | $15,120 | $23,980 |
| 2013 | $1,249 | $39,095 | $15,120 | $23,975 |
Source: Public Records
Map
Nearby Homes
- 656 S Kellner Rd
- 629 Eastmoor Blvd
- 624 Elizabeth Ave
- 824 S Ashburton Rd
- 2947 E Mound St
- 845 S Hampton Rd
- 430 S James Rd
- 2981 Templeton Rd
- 928 S Ashburton Rd
- 864 S Waverly St
- 712 Chelsea Ave
- 849 Ruby Ave
- 2917 Ashby Rd
- 871 Ruby Ave
- 1037-1039 S James Rd
- 1048 S James Rd
- 2729 Bexley Park Rd
- 843 Kenwick Rd
- 279 S Ashburton Rd
- 789 Chelsea Ave
- 645 S Kellner Rd
- 661 S Kellner Rd
- 661 S Kellner Rd Unit 1
- 669 S Kellner Rd
- 637 S Kellner Rd
- 648 Brookside Dr
- 640 Brookside Dr
- 656 Brookside Dr
- 675 S Kellner Rd
- 634 Brookside Dr
- 648 S Kellner Rd
- 664 Brookside Dr
- 672 S Kellner Rd
- 640 S Kellner Rd
- 624 Brookside Dr
- 683 S Kellner Rd
- 683 S Kellner Rd Unit A/B
- 670 Brookside Dr
- 678 S Kellner Rd
- 618 Brookside Dr
Your Personal Tour Guide
Ask me questions while you tour the home.