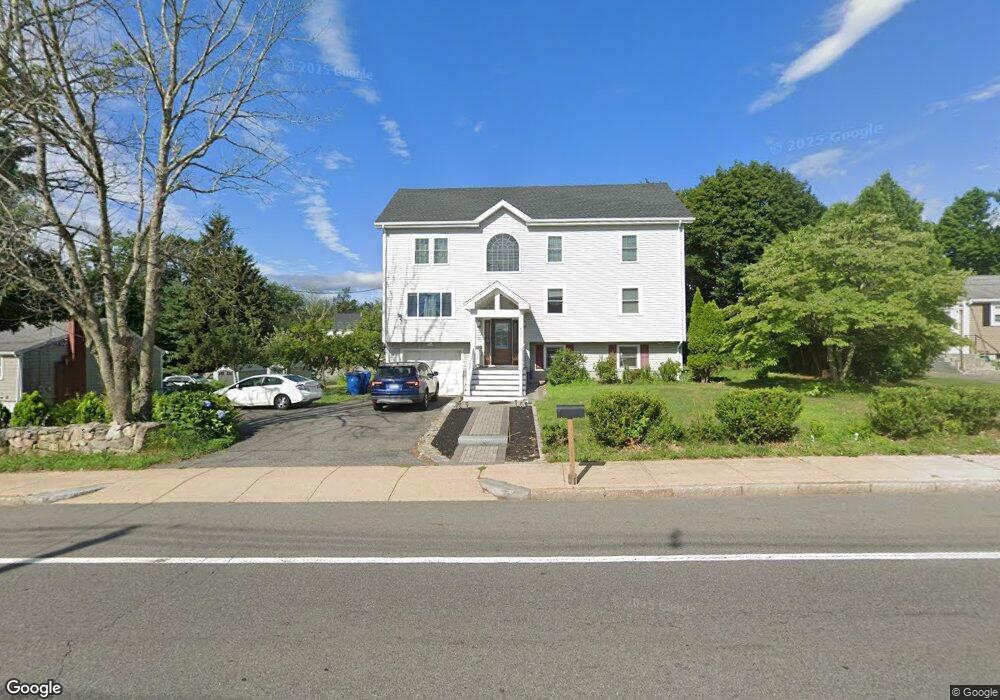
655 S Main St Randolph, MA 02368
South Randolph NeighborhoodEstimated Value: $568,000 - $799,000
3
Beds
1
Bath
1,144
Sq Ft
$591/Sq Ft
Est. Value
About This Home
This home is located at 655 S Main St, Randolph, MA 02368 and is currently estimated at $675,890, approximately $590 per square foot. 655 S Main St is a home located in Norfolk County with nearby schools including Randolph High School and Lighthouse Baptist Christian Academy.
Ownership History
Date
Name
Owned For
Owner Type
Purchase Details
Closed on
Jan 25, 2005
Sold by
Orlando Chester E and Marsh James A
Bought by
Anbazhagan Francis A and Rajaretnam Maria M
Current Estimated Value
Home Financials for this Owner
Home Financials are based on the most recent Mortgage that was taken out on this home.
Original Mortgage
$301,500
Interest Rate
5.71%
Mortgage Type
Purchase Money Mortgage
Purchase Details
Closed on
Feb 3, 1994
Sold by
Good Stephen M and Good Thomas M
Bought by
Orlando Chester E
Home Financials for this Owner
Home Financials are based on the most recent Mortgage that was taken out on this home.
Original Mortgage
$21,900
Interest Rate
7.12%
Mortgage Type
Purchase Money Mortgage
Purchase Details
Closed on
May 12, 1993
Sold by
Coop Bk Concord
Bought by
Good Thomas M and Good Stephen M
Create a Home Valuation Report for This Property
The Home Valuation Report is an in-depth analysis detailing your home's value as well as a comparison with similar homes in the area
Home Values in the Area
Average Home Value in this Area
Purchase History
| Date | Buyer | Sale Price | Title Company |
|---|---|---|---|
| Anbazhagan Francis A | $335,000 | -- | |
| Orlando Chester E | $141,900 | -- | |
| Good Thomas M | $42,500 | -- |
Source: Public Records
Mortgage History
| Date | Status | Borrower | Loan Amount |
|---|---|---|---|
| Open | Good Thomas M | $20,000 | |
| Open | Good Thomas M | $280,000 | |
| Closed | Anbazhagan Francis A | $301,500 | |
| Previous Owner | Good Thomas M | $21,900 | |
| Closed | Good Thomas M | $0 |
Source: Public Records
Tax History Compared to Growth
Tax History
| Year | Tax Paid | Tax Assessment Tax Assessment Total Assessment is a certain percentage of the fair market value that is determined by local assessors to be the total taxable value of land and additions on the property. | Land | Improvement |
|---|---|---|---|---|
| 2025 | $7,129 | $614,000 | $238,700 | $375,300 |
| 2024 | $6,806 | $594,400 | $234,100 | $360,300 |
| 2023 | $6,744 | $558,300 | $212,900 | $345,400 |
| 2022 | $6,221 | $457,400 | $177,400 | $280,000 |
| 2021 | $5,140 | $347,800 | $147,800 | $200,000 |
| 2020 | $5,141 | $344,800 | $147,800 | $197,000 |
| 2019 | $5,060 | $337,800 | $140,800 | $197,000 |
| 2018 | $5,015 | $315,800 | $128,000 | $187,800 |
| 2017 | $4,741 | $293,000 | $122,000 | $171,000 |
| 2016 | $4,601 | $264,600 | $111,000 | $153,600 |
| 2015 | $4,501 | $248,700 | $105,800 | $142,900 |
Source: Public Records
Map
Nearby Homes