655 West St Walpole, MA 02081
Estimated Value: $584,000 - $647,000
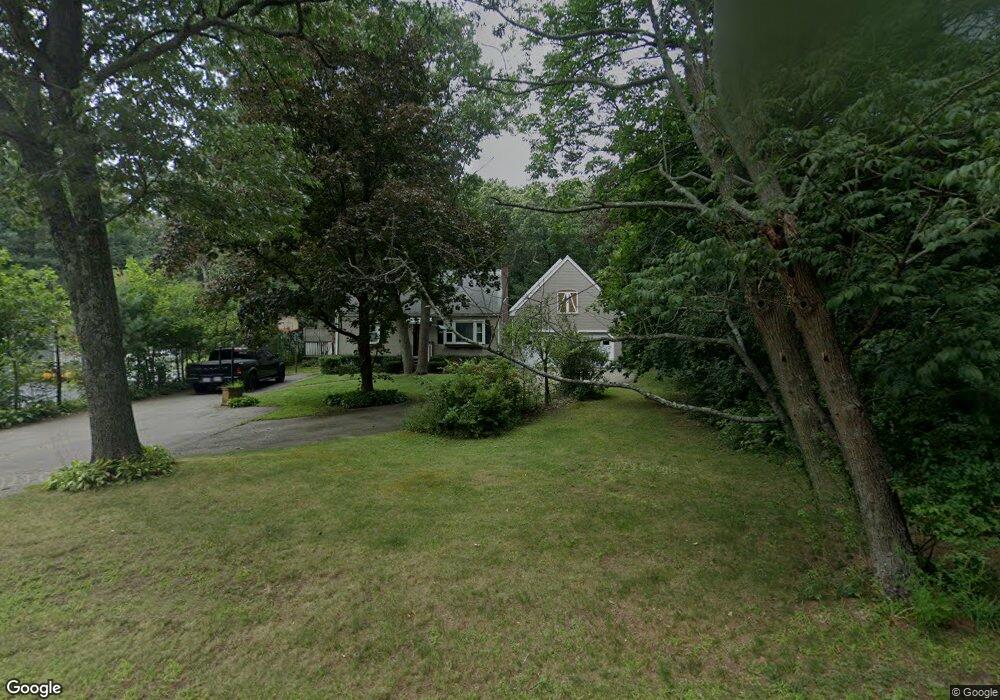
About This Home
This home is located at 655 West St, Walpole, MA 02081 and is currently estimated at $617,075, approximately $487 per square foot. 655 West St is a home located in Norfolk County with nearby schools including Elm Street School, Eleanor N. Johnson Middle School, and Walpole High School.
Ownership History
We collect this data history from publicly available records. To have your information removed, we recommend requesting removal directly through your county’s website.
Purchase Details
Home Financials for this Owner
Home Financials are based on the most recent Mortgage that was taken out on this home.Home Values in the Area
Average Home Value in this Area
Purchase History
We collect this data history from publicly available records. To have your information removed, we recommend requesting removal directly through your county’s website.
| Date | Buyer | Sale Price | Title Company |
|---|---|---|---|
| $257,500 | -- |
Mortgage History
We collect this data history from publicly available records. To have your information removed, we recommend requesting removal directly through your county’s website.
| Date | Status | Borrower | Loan Amount |
|---|---|---|---|
| Open | $206,000 |
Tax History
We collect this data history from publicly available records. To have your information removed, we recommend requesting removal directly through your county’s website.
| Year | Tax Paid | Tax Assessment Tax Assessment Total Assessment is a certain percentage of the fair market value that is determined by local assessors to be the total taxable value of land and additions on the property. | Land | Improvement |
|---|---|---|---|---|
| 2025 | $7,228 | $563,400 | $313,300 | $250,100 |
| 2024 | $7,032 | $531,900 | $301,600 | $230,300 |
| 2023 | $6,846 | $492,900 | $262,400 | $230,500 |
| 2022 | $6,475 | $447,800 | $242,600 | $205,200 |
| 2021 | $6,113 | $411,900 | $228,700 | $183,200 |
| 2020 | $6,096 | $406,700 | $216,100 | $190,600 |
| 2019 | $5,913 | $391,600 | $208,700 | $182,900 |
| 2018 | $5,470 | $358,200 | $199,100 | $159,100 |
| 2017 | $5,281 | $344,500 | $191,700 | $152,800 |
| 2016 | $5,166 | $332,000 | $186,500 | $145,500 |
| 2015 | $5,016 | $319,500 | $178,900 | $140,600 |
| 2014 | $4,864 | $308,600 | $178,900 | $129,700 |
Map
- 3 Granite St
- 9 Weathervane Dr Unit 45
- 530 West St Unit 1
- 10 Forrest Rd
- 6 Tiger Terrace Unit 25
- 21 Chandler Ave
- 18 Weathervane Dr Unit 24
- 16 Weathervane Dr Unit 23
- 349 Lincoln Rd
- 124 Clear Pond Dr
- 9 Macdonald Cir
- 29 Merganser Way Unit 29
- 164 Granite St
- 75 William St
- 24 Marion St
- 1429 Main St Unit 5E
- 120 Spring St
- 85 Broad St
- 270 Elm St
- 85 Lewis Ave Unit 85
Ask me questions while you tour the home.